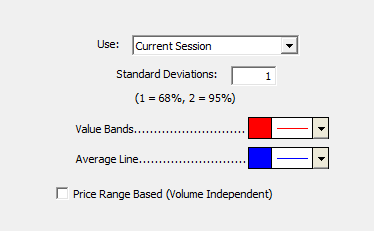
The Value Area Indicator provides an automated band representing the volume-weighted Value Area. The Value Area bands represent the prices between which a certain percent of the volume was traded. The Value Area preferences have a setting for "Standard Deviations". A standard deviation setting of 1 will result in bands containing 68% of the volume. A standard deviation of 2 will result in bands containing 95% of the volume. The Value Area is of special interest to TPO Profile users, and will give these users a way to depict this Value Area on a chart. The Value Area may be drawn using the current sessions data, the previous sessions data, or both. In addition to the bands, the value area indicator also draws a horizontal reference line at the volume-weighted average price based on the session specified. To select the Value area indicator, click (or double-click) on the horizontal line representing the volume-weighted average price (the middle line).
Additional Notes: The value area indicator is computed using 1-minute bars (regardless of the periodicity of the charts, scan, etc). There is currently no way to reference "historical" value area results other than current and previous session values. The upper and lower Value Area bands area available in RTL using tokens VAU and VAD. In order to access the average, just use "(VAU + VAD)/2".
The Formula
If "Price Range Based" checkbox is unchecked... 

 Upper Band = CL + StdDev * X Lower Band = CL - StdDev * X X = # of Standard Deviations specified in Value Area Preferences
If "Price Range Based" checkbox is checked... CL = (High + Low) / 2 StdDev = (High - Low) / 2 Upper Band = CL + StdDev * X Lower Band = CL - StdDev * X X = # of Standard Deviations specified in Value Area Preferences
Presentation

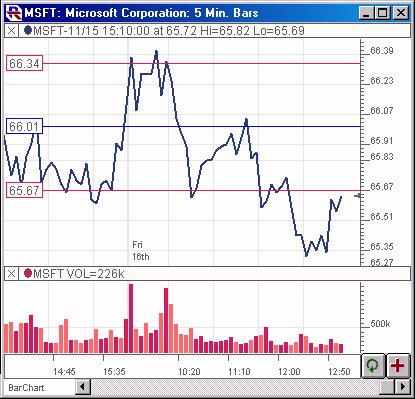
Above is a 5-Minute line chart on the close of the Microsoft (MSFT). The Value Area bands can be seen overlaying the price data in the upper chart pane, with the volume bars in the lower pane. The red lines represent the upper and lower bands encompassing 68% of the current sessions volume based on the preferences seen below. The center blue line is the volume weighted average of today's close.


