Value Area Indicator (VAU, VAD)
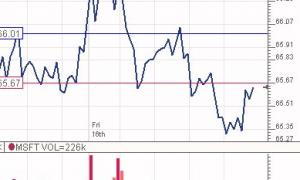
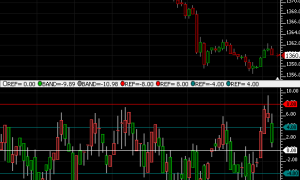
The Value Area Indicator provides an automated band representing the volume-weighted Value Area. The Value Area bands represent the prices between which a certain percent of the volume was traded. The Value Area preferences have a setting for "Standard Deviations". A standard deviation setting of 1 will result in bands containing 68% of the volume. A standard deviation of 2 will result in bands containing 95% of the volume. The Value Area is of special interest to TPO Profile users, and will give these users a way to depict this Value Area on a chart.


