Authored by Dimitris Tsokakis, the relative slope takes an exponential moving average of typical price (HLC/3), commonly a 20 period EMA but the period is customizable. It then takes the resulting values, and for each value, the previous value is subtracted and the result is divided by the sum of the two values. These results are then further smoothed with a 3 period EMA. A common system for trading the RELS would be to buy when it turned positive:
RELS > 0 AND RELS.1 <= 0
and sell when it turned negative:
RELS < 0 AND RELS.1 >= 0
Presentation

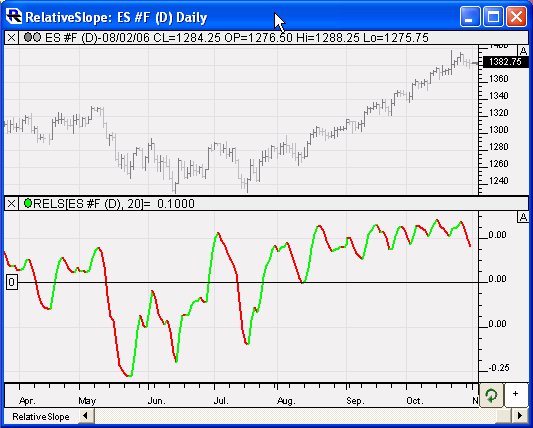
Above is a Daily Chart of the S&P E-mini Futures Contract (ES #F, eSignal). The two-colored line in the lower pane represents the 20 period Relative Slope.


