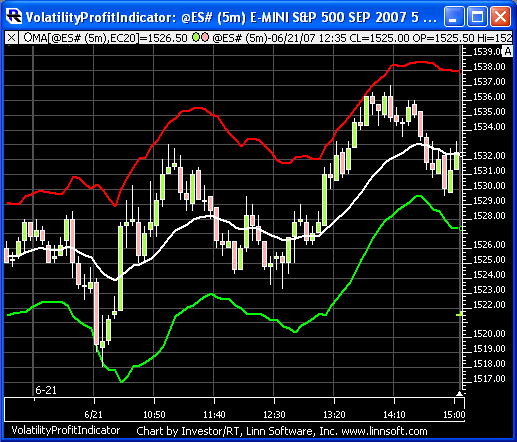
The Volatility Profit Indicator had it's origins in a February 2005 Article in TASC titled "The Truth About Volatility" by Jim Berg. This article was geared toward longer term (weekly) charts, but has been found to work equally well for shorter term trading on intraday charts. The high band is computed by taking a moving average of the highs and adding a multiple of the average true range. The lower band is computed by taking a moving average of the lows and subtracting a multiple of the average true range. The moving average type and period, along with the true range period and multiplier, are all customizable. When price reaches the high band, it is considered overbought, and the user might look to exit a long position and/or enter a short. Conversely, when price reaches the low band, it is considered overextended to the downside, and the user might look to exit a short and/or enter a long position.
Presentation

Above is a 5-minute candle chart of the S&P E-mini Futures Contract (@ES#, IQ Feed). The candles are overlaid with the Volatility Profit Indicator, using the preferences seen below, showing the High Band in red and Low Band in green. The chart also contains a 20 period EMA in white.


