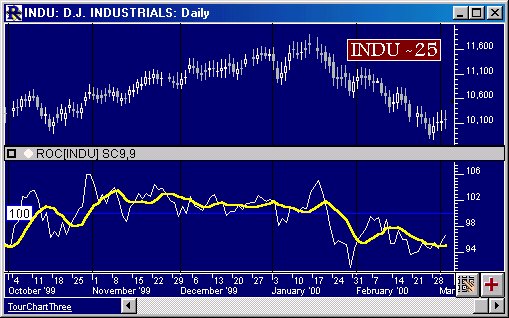
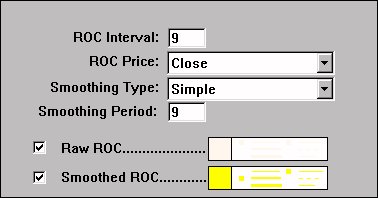
Rate of change is a price momentum indicator. It is a simple calculation of the current price divided by the price some number of periods ago. For example, if the current price is 50 and the price 30 days ago was 40, then the 30-day rate of change is 50/40 or 1.25. The result is multiplied 100 and the resulting line oscillates around the 100 reference line. An optional smoothing moving average may be applied to the raw rate of change. Either or both raw and smoothed lines may be draw in the chart window. Rate of Change is part of the Investor/RT scan language also. The rate of change indicator is essentially equivalent to the "Momentum" indicator. The difference is that the rate of changes uses the ratio of prices while momentum uses the difference in prices, and the rate of change is scaled differently and oscillates around 100 instead of zero.
Presentation

Above is a 5 Minute Bar Chart of an S&P 500 Future Contract (SP`M). The bold green line in the lower pane represents the High Line of the Random Walk, while the red line represents the Low Line, as specified in the preferences below.
Formula
Keyboard Adjustment
The Rate of Change indicator can be accessed within RTL using the token ROC.


