DayTypes (RTX)

The DayTypes RTX Extension requires the TPO Profile Package.

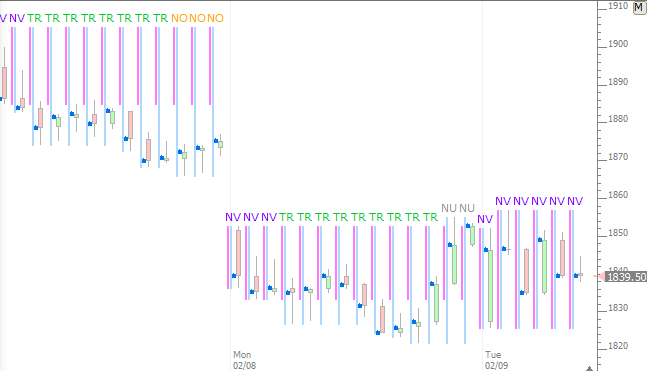
The DayTypes RTX Extension determines the developing day type throughout the session and labels each bar with the day type in effect as of that bar.  The determination of day type is rooted in Market Profile methodology and is based on the relationship of the range of the initial balance (1st 60 minutes of trading) relative to the range of the full session and the relative location of the closing price. Currently, DayTypes identifies the following 6 day types: Neutral, Neutral Extreme, Normal, Normal Variation, Trend, and Non-Trend.  An option to "Draw Price Lines" plots the developing Initial Balance, Day Range, and Close to the left of each bar to help visualize the logic behind the determination of the day type.  The day type is labeled above each bar if space is avaiable, with each type having it's own user-specified color.  If there is not enough room to draw text for each bar, a color dot will appear above each bar.  Zoom in using the scroll wheel for text to appear.

Presentation
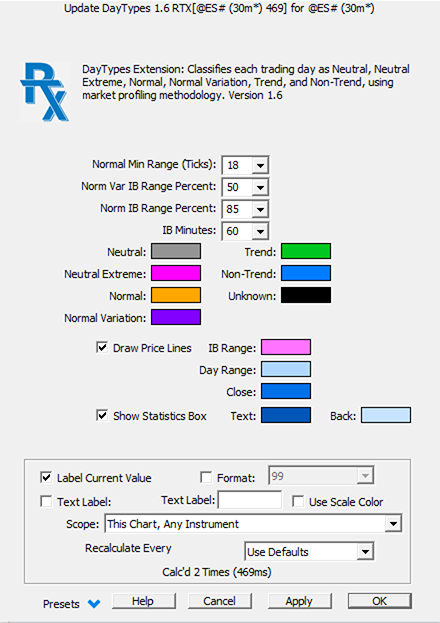
DayTypes Prefs

  • Normal Min Range (Ticks): Normal Minimum Range is specified in tick increments and defaults to 18. This value is used in the determination of the Normal day type and requires the range to meet or exceed this level for Normal to be in play. Days that otherwise meet the Normal criteria but do not meet this range requirement fall into the Non-Trend category.
  • Norm Var IB Range Percent: Normal Variation IB Range Percent is the minimim percentage required of of the IB Range relative to the Day Range in order to achieve a Normal Variation day type. Defaults to 50
  • Norm IB Range Percent: Normal IB Range Percent is the minimim percentage required of of the IB Range relative to the Day Range in order to achieve a Normal day type. Defaults to 85. If a Normal Day meets all other criteria but not the IB Range Percent criteria, then a Normal Variation day type is generally in play instead assuming it meets the Norm Var IB Range Percent
  • Colors: Each day type has it's own unique color which will be used for the day type dot or label above each bar. The day type is labeled above each bar if space is avaiable, with each type having it's own user-specified color. If there is not enough room to draw text for each bar, a color dot will appear above each bar. Zoom in using the scroll wheel for text to appear
  • Draw Price Line: An option to "Draw Price Lines" plots the developing Initial Balance, Day Range, and Close to the left of each bar to help visualize the logic behind the determination of the day type. Users have option for color of IB and Day Range bands as well as the Close dot.
Day Types Chart (RTX)
The DayTypes RTX Indicator determines the developing day type throughout the session and labels each bar with the day type in effect as of that bar.  The determination of day type is rooted in...

Read more Download

No videos. Let us know if you'd like to see one added.