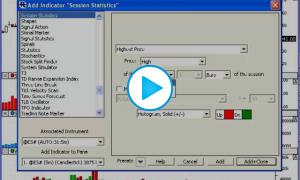
The Session Statistics Indicator computes historical statistics for an instrument or an indicator. The The Session Statistics preferences use the general format: [Statistic] of [Price] of the [First/Last] X [Minutes/Bars] of the Session The Statistic options include:
- Highest Price
- Lowest Price
- Range of Price
- High/Low Range
- Average Price
- Sum of Price
A standard list of Prices is provided as follows:
- Close
- High
- Low
- Open
- OHLC/4
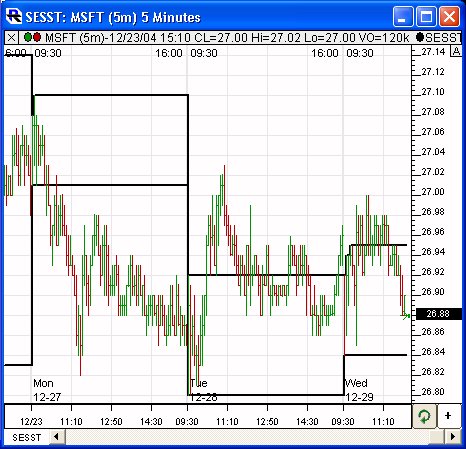
As an example, a user may want to access the "Highest High of the First 30 Minutes of the Session". This indicator makes that operation very quick and easy. The result will be as follows. Let's assume in our example we are looking at 10-minute data. On the first bar, the result will be the high of that first bar (first 10 minutes). On the second bar, the result would be the highest high of the first two bars (first 20 minutes). Then, on the third and remaining bars of the session, the result would be the high of the first 3 bars (first 30 minutes). Then on the first bar of the following session, the result will again reset to the highest high of that first bar, and everything starts over again. To see the effect, simply add the indicator to a chart.
Presentation
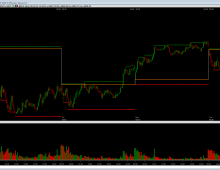
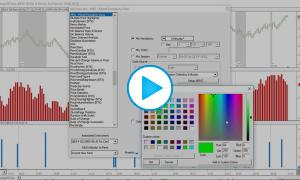
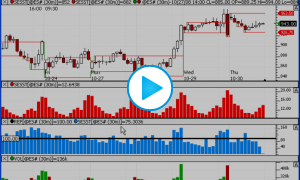
Above is a 5-minute Bar Chart of an Microsoft Corporation (MSFT). The Session Statistics indicator has been added twice to the chart, once showing the highest high of the first 30 minutes of each session (using preferences seen below), and once showing the lowest low of the first 30 minutes of the session.


