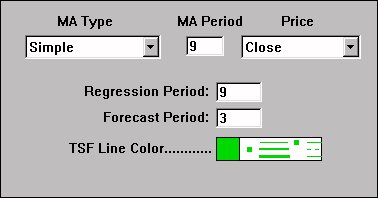
This technical indicator performs linear regression analysis. The value of TSF for each bar is based on a regression analysis of the preceding N bars. N is called the regression period in the setup window for TSF. The user specifies a forecast period F. F is used to derive a predicted price value, a forecast, F periods in the future based on the slope of the regression line for the preceding N periods. This indicator is often used in trading systems in conjunction with a moving average to generate trading signals when a moving average line crosses a time series forecast line.
Presentation

Above is a 15 Minute Continuous Line Chart of the Dow Jones Industrial Index (INDU). The bold green line represents the Time Series Forecast based on the preferences specified below.


