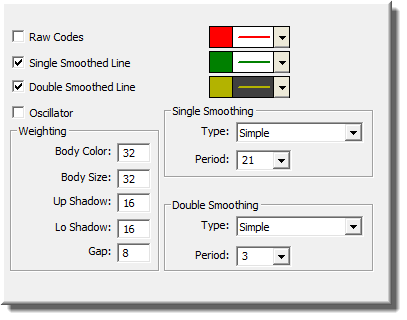
The Candle Code indicator is used to assign a numerical value to each candle based on five candlestick characteristics, including Body Color, Body Size, Upper Shadow, Lower Shadow, and Gap. Positive candle code values represent bullish candles while negative candle code values represent bearish candles. The more positive the code, the more bullish the candle. The more negative the code, the more bearish the candle. Each of the five candle characteristics can be weighted according to the user's preferences. A higher weight will make that characteristic have a greater influence on the codes value. A weight of zero will cause that characteristic to have no influence on the code.
The raw candle code values are very noisy when charted, and may be both single and double-smoothed. An oscillator may also be draw which represents the difference between the single and double-smoothed values. Signals are produced when the single smoothed line crosses over the double-smoothed line, or when the double smoothed line changed direction of slope in extreme positive or negative territory.
CandleCode = BodyColor + BodySize + UpperShadow - LowerShadow + Gap
where...
if(ABS(CL - OP) >= AvgBodySize * 2) BodySize = BodySizeWeight else BodySize = BodySizeWeight * ABS(CL - OP) / (AvgBodySize * 2)
if(HI - MAX(CL,OP) >= AvgShadow * 2) UpperShadow = UpperShadowWeight else UpperShadow = UpperShadowWeight * (HI - MAX(CL,OP)) / (AvgShadow * 2) if(MIN(CL,OP) - LO >= AvgShadow * 2) LowerShadow = LowerShadowWeight else LowerShadow = LowerShadowWeight * (MIN(CL,OP) - LO) / (AvgShadow * 2)
Gap = GapWeight * (OP - CL.1) / AvgGap
if(CL > OP) BodyColor = BodyColorWeight else if(CL < OP) BodyColor = -1 * BodyColorWeight else (CL = OP) BodyColor = 0
AvgBodySize = Average Body Size over entire data series AvgShadow = Average Shadow over entire data series AvgGap= Average Gape over entire data series
SingleSmooth = MA(CandleCode, SingleType, SinglePeriod) DoubleSmooth = MA(SingleSmooth, DoubleType, DoublePeriod) Oscillator = SingleSmooth - DoubleSmooth
Presentation

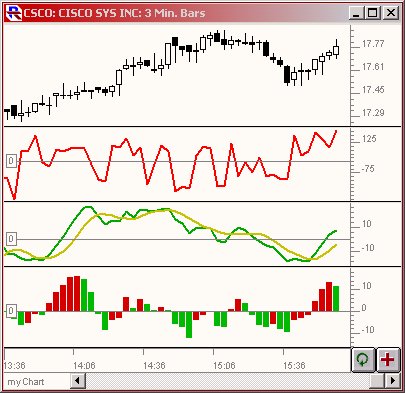
Above is a 3-Minute Candlestick Chart of Cisco Systems (CSCO) . The 2nd pane shows the raw candle code data. The 3rd pane shows a single and double smoothing of the data. The 4th pane shows an oscillator representing the difference between the single and double-smoothed lines.


