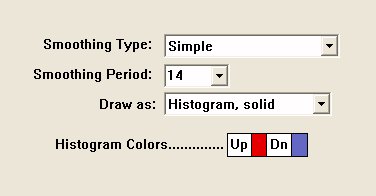
Balance of Power, introduced by Igor Livshin, attempts to measure the strength of buyers vs. sellers by assessing the ability of each to push price to an extreme level. Livshin published this indicator in the August 2001 issue of Stocks and Commodities Magazine. The article describes a somewhat involved calculation of the BOP, but in essence, BOP calculates raw values for each bar as:
(CLOSE- OPEN) / (HIGH - LOW)
The resulting raw BOP values can be optionally smoothed using any moving average type and drawn as a line or histogram.
The BOP oscillates between extremes of -1 and +1.
Livshin goes on to make the following statements...
- For daily charts, a 14-period moving average is recommended, though the number of periods varies depending on the nature of the market and the time frame.
- One of the most important properties of BOP is the level at which it clusters its tops and bottoms. During bull markets, its tops often reach the upper limit and never reach the bottom level. During bear markets, the picture is reversed.
- BOP supports price divergence, trends, and overbought-oversold levels.
- A change in the BOP trend serves as a warning signal and should be confirmed by a change in the price direction.
Presentation

Above is a Daily Candlestick Chart of the Adobe Systems (ADBE). The Balance of Power Indicator can be seen in the lower pane, drawn as an oscillator in red and blue.
Formula
Keyboard Adjustment
The smoothing period involved in the BOP indicator can be adjusted directly from they keyboard without opening up the preference window. First, select the indicator, then use the up and down arrow keys to adjust the smoothing period up or down by 1.


