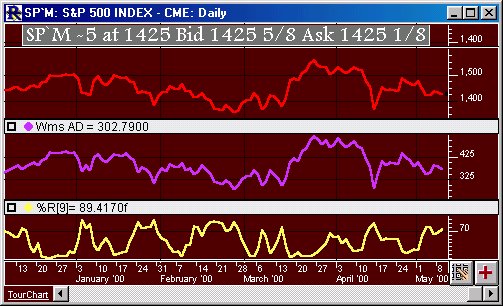
This indicator measures market pressure by comparing the relationship between Closing price and daily range to quantify accumulation, or buying pressure, and distribution, or selling pressure. The indicator is calculated as follows: When current close is higher than the previous close, AD increases by current Close minus minimum (Current Low or Previous Close). When current Close is lower than the previous Close, AD decreases by maximum (Current High or Previous Close). Look for divergence of William's AD and price. Rising prices and falling AD can indicate a selling opportunity. Falling prices and a rising AD can indicate a buying opportunity.
Presentation

Above is a red Daily Line Chart of and S&P 500 Future contract. The purple line in the middle pane represent the Williams AD line, defined by the preferences below. The yellow line in the lower pane represents the Williams %R line. The Preferences


