Volume Price Statistics (VPS)

Volume Price Statistics requires the Volume Analysis Package.

The Volume Price Statistics indicator provides the user with a variety of statistical measures based on the volume at price.

Presentation

vps

Above is a 30-minute of the S&P Mini Contract (ES #F, eSignal). The VPS indicator is plotted twice in the chart. In the upper pane, it's showing the Volume POC as a red stepped line. In the lower pane, it's showing the POC Volume as a histogram.

vpsPrefs
vpsPrefs2

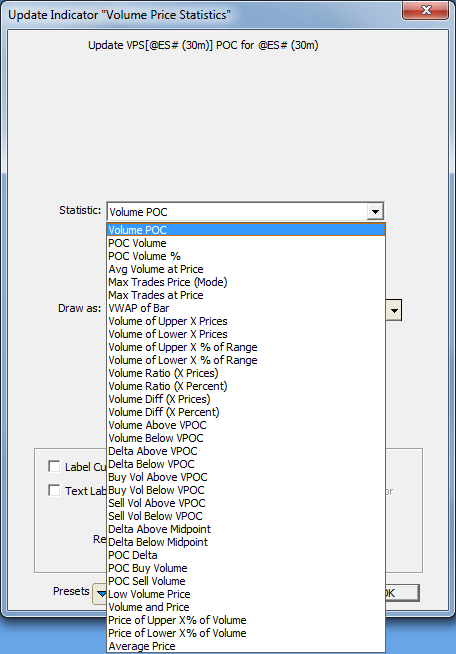
Statistic

Style and color used to draw the VWAP and VWAP bands (if applicable).

  • Volume POC - The volume based POC, or price within the bar at which the most volume traded.
  • POC Volume - The volume of the POC, or the maximum volume at any price within the bar.
  • POC Volume % - The POC Volume as a percent of the total volume of the bar.
  • Avg Volume at Price - The average volume at price of all prices traded within the bar.
  • Max Trades Price (Mode) - The price at which the most trades were executed.
  • Max Trades at Price - The maximum amount of trades at any single price within the bar.
  • VWAP of Bar - The volume-weighted average price, computed using the volume and price of all trades within the bar.
  • Volume of Upper X Prices - The total volume of the highest x prices in the bar.
  • Volume of Lower X Prices- The total volume of the lowest x prices in the bar.
  • Volume of Upper X % of Range - The total volume of the highest x% of the range of the bar.
  • Volume of Lower X % of Range- The total volume of the lower x% of the range of the bar.
  • Volume Ratio (X Prices) - Ratio of the volume at the upper x prices divided by the volume at the lower x prices.
  • Volume Ratio (X Percent)- Ratio of the volume at the upper x% of bar divided by the volume at the lower x% of bar.
  • Volume Diff (X Prices) - Difference between the volume at the upper x prices and the volume at the lower x prices.
  • Volume Diff (X Percent)- Difference between the volume at the upper x% of bar and the volume at the lower x% of bar.

Draw as

Style, color, and size used to draw the VPS indicator within the chart.

No examples. Let us know if you'd like to see one added.
No videos. Let us know if you'd like to see one added.