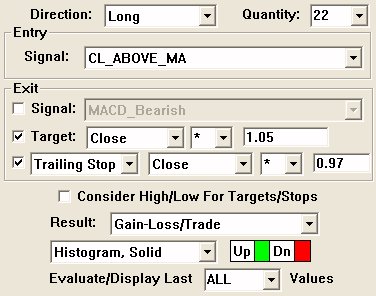
An indicator named "System Simulator" (SSIM) has been added to Investor/RT. SSIM gives the user the ability to quickly chart a simple trading system. SSIM has settings for Entry and Exit (a group box for each). The Entry is controlled by a single Scan/Signal.
SSIM will enter into a position when the Entry Scan/Signal hits true. An "orientation" option dictates whether the system is "Long" or "Short". If the system is "Long", then SSIM will go long when the Entry signal is true. If the system is "Short", then SSIM will go short when the Entry signal is true. Similarly, the Exit section has options for an exit Scan/Signal, a target, and a stop/trailing stop. Any or all of these three options may be used to control when the system exits open positions.
The "Target" option allows you to specify a target based on an arithmetic relationship to the price of the entry bar. For instance, a target of "Close + 2" could be specified to exit when the price increases $2 from the closing price of the entry bar. Or a target of "High * 1.05" could be specified to exit when the price increases to 5% above the high of the entry bar.
When the system is short, targets like "Close + -2" and "Low * 0.95" might be used. The Stop/Trailing Stop exit option works similarly to the target option. The user may specify either a "Stop" or a "Trailing Stop". If a "Stop" is specified, the stop will be computed only once. The stop value is based on a user-specified relationship to the price of the entry bar (just like the target was computed). "Trailing Stops", however, may change value on each bar, but may only move in the direction of the current price. For instance, if a long system used a trailing stop of "Low + -1", then each bar would check to see if $1 less than the current low was greater than the existing stop value, and if so, replace the stop with this stop. In a long system, the trailing stop can only increase (never decrease), while in a short system, the trailing stop can only decrease (move closer to current price action).
SSIM will undergo quite a bit of enhancement in the coming releases. Currently, the only "result" option available is to show "Gain/Loss". This "Gain/Loss" option represents the cumulative gain or loss based on all trades made throughout the chart (based on the viewing period). The result may be drawn as a line or a histogram. In coming releases, more "result" options will be added. Also, a "price multiplier" option will be added to simulate buying or selling a given number of shares on each trade. Currently the system assumes trading a single share each trade (raw price change of one share for gain/loss). And a "lookback period" will be added to give the user control over how many bars will be used in evaluation ("last 100 bars" for example).
Presentation

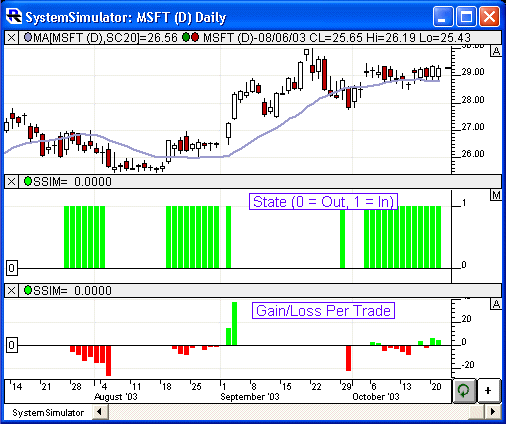
Above is a Daily Candlestick Chart of an Microsoft Corporation (MSFT). The System Simulator (SSIM) indicator is drawn twice in the chart. The middle pane represents the SSIM with the a result of "State (In = 1, Out = 0). The lower pane represents SSIM with the preferences shown below (Result: Gain-Loss/Trade). Both are drawn as a histogram.


