ScatterPlot (RTX)

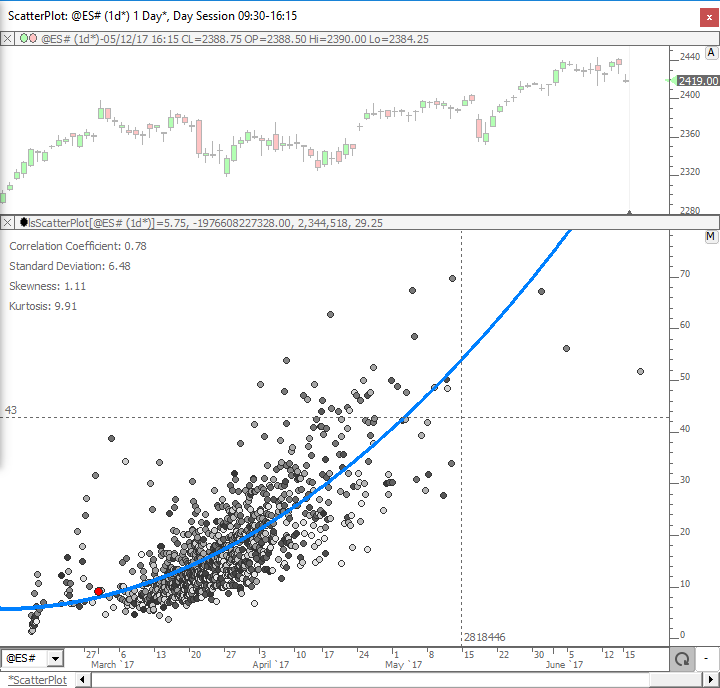
ScatterPlot takes two custom indicators and plots one on the horizontal (X Axis) and one on the vertical (Y Axis) and then computes a best fit polynomial regression line through the data of user-specified degree. Any two custom indicators may be used for the data set of this analysis. Each data point represents the values of the two custom indicators on any given bar. Each bar is drawn as a point/dot in the scatter plot. For example, the indicator can plot the daily volume versus the daily range in price. With the resulting best fit line, a user may determine what volume should be expected for any given daily range (or visa versa). An optional Info Box provides several statistics of the data set: Correlation Coefficient; Standard Deviation; Skewness; and Kurtosis. Dot color may be shaded based on X Value, Y Value, or Time. The value of the current bar can be highlighted in a unique color. ScatterPlot introduces a new dimension of market data analysis in Investor/RT. See the Scatter Plot wiki for more information.

Presentation
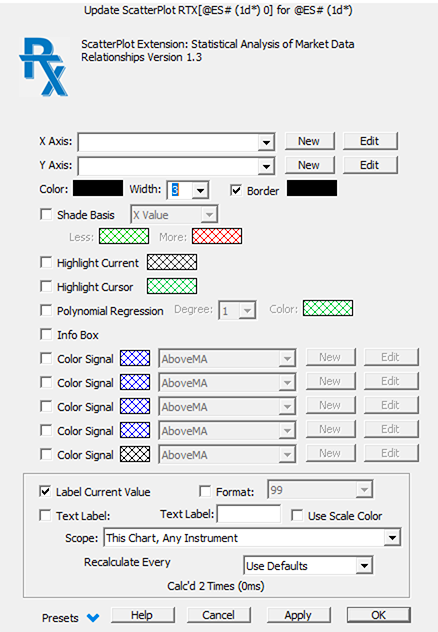
Scatterplot Prefs

  • X Axis - Custom Indicator that will be plotted on the horizontal X Axis.  This custom indicator will provide the X coordinates of each plotted dot of the data set.
  • Y Axis - Custom Indicator that will be plotted on the vertical Y Axis.  This custom indicator will provide the Y coordinates of each plotted dot of the data set.
  • Color - Color of plotted dots.
  • Width - Width of plotted dots.
  • Border - Optional 1 pixel border drawn around each dot in user specified color.
  • Shade Basis - Shading options include X Value, Y Value, and Time.  If X Value is chosen, the dots with the highest X Value will be drawn in the "More" color while the smaller X Values will be drawn in the "Less" color with a gradient for each value in between.  Same applies to Y Values.  For the Time options, the more recent dots are drawn in the More color.
  • Highlight Current - Highlights the dot for the current (right-most) bar in user specified color.
  • Polynomial Regression - Best fit line, using user-specified polynomial degree.
  • Info Box - Info Box which provides statistics including Correlatoin Coefficient, Standard Deviation, Skewness, and Kurtosis of the data set.
ScatterPlot (@ES#)
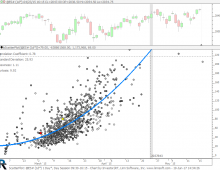
Scatter Plot (RTX). This chart was uploaded by Investor/RT 12.7.6 showing symbol: @ES#.

Read more Download

Pop-up Video Description View
Scatter Plot (RTX) Introduction

ScatterPlot takes two custom indicators and plots one on the horizontal (X Axis) and one on the...

 Watch