The bid/ask feedback has been improved since this tutorial was originally written. Instead of dots at the bid and ask, we now draw a vertical line from the bid to the ask price. There is also a small horizontal line representing the current price that protrudes left from the bid/ask line (this becomes an arrow when in "Presentation Mode").
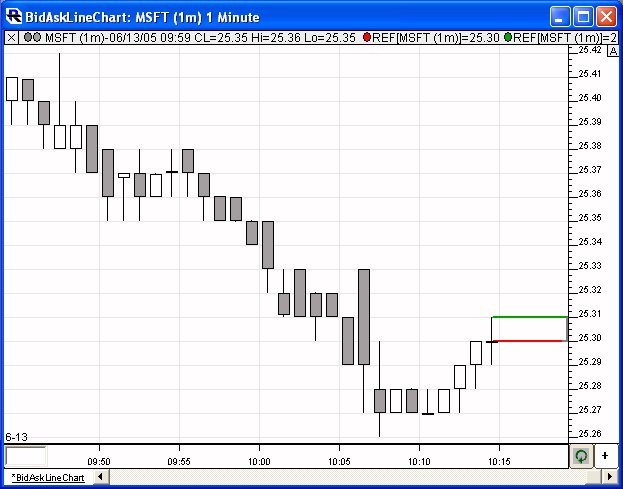
If you'd like a more defined line and something you can have more control over, you might want to user the Reference Line indicator to add reference lines at both the bid and ask prices, as seen in the chart below. You can import this chart by saving this chart definition to your computer (right-click on link and choose Save Target As), and then choose File: Import: Chart Definition from within Investor/RT, and then locating the chart definition text (.txt) file you just saved.

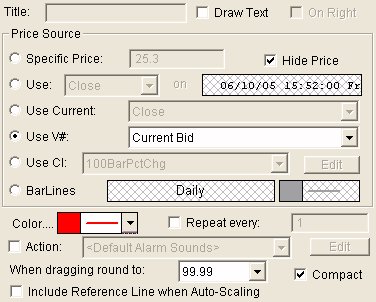
The preferences of the bid reference line can be seen below:

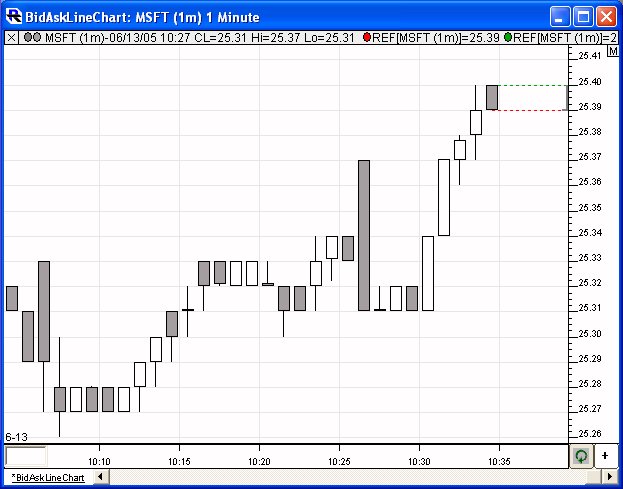
The preferences of the ask reference line are identical, except that Current Ask is selected instead of Current Bid, and a color of green is used. You can make these lines longer or shorter by simply adjusting the lookahead period located at the bottom of the View Period tab of chart preferences (or just shift-dragging the horizontal scale along the bottom of the chart). You might also choose to make the line dotted or dashed (dotted or dashed lines require a width of 1 pixel). Using a 1-pixel dotted line actually makes it much easier to view the small current price line that protrudes left from the bid/ask line (as seen in chart below).

However, when in Presentation Mode, the current price is very clear regardless of whether you've selected dotted 1 pixels lines, or solid 2 pixel lines.
You might also choose to show the price of the bid and ask lines by simply unchecking the Hide Price checkbox in the preferences.
Notice that the Include Reference Line when Auto-Scaling checkbox is unchecked, so these lines will not effect the scaling in any way. This will be helpful if your data feed sends off-the-scale numbers during off-market hours.

