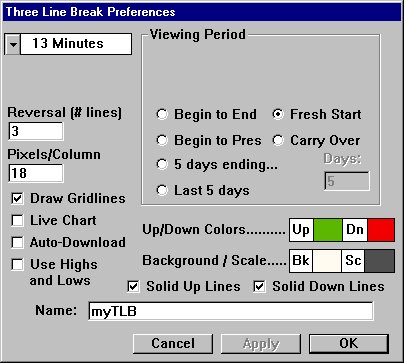
The processing of data for Point and Figure (PNF) and Three Line Break (TLB) charts is dependent on four preferences settings. Those are:
- Periodicity - What is the timeframe of the data that you would like to use to create the chart? . . . Daily, 1 Minute, 13 Minute, etc.
- Viewing Period - What it the range of time/dates from which the data for the chart should be extracted? Last 2 years, Last 10 days, 10/09/99 to Present, etc. If you choose Carry Over, then the last price of last bar of the previous day will be used as the first price processed, then the closing prices of the Intraday bars will be processed thereafter. If you choose Fresh Start, then the opening price of the first bar of the day will be the first price processed, followed by the closing price of each bar thereafter. These two options are only available for Intraday periodicities.
- Use Highs and Lows - This checkbox determines how historical data will be processed. When originally creating the chart from historical data, how should the data be handled. If this checkbox is checked, then the highs and lows are used (the details regarding the order in which these are processed is discussed below). If this checkbox is unchecked, then only the closing prices are used.
- Live Chart - This checkbox determines how the new, real time data will be handled by your chart. If the "Live Chart" checkbox is checked, then a line will be drawn to the right of the chart that was built from historical data, and from this point forward, every tick will be processed by the chart. If this checkbox is left unchecked, then a timer will be set and data will be processed based on your periodicity. For instance, if you have a 13 minute periodicity, then every 13 minutes, the last price will be processed by your chart...and your chart will only receive new data every 13 minutes.
Let's walk through an example based on the preferences seen below. Although the preferences seen below are labeled Three Line Break Preferences, they apply equally to Point and Figure Charts.

Our chart is going to load 2 days of 13 minute bars. This raises another point. We must be collecting intraday data on the ticker for which we are creating the chart. See the Data Maintenance section for additional information collecting proper intraday data.
Let's say that we are creating this chart using INTC at 1:30 PM EST on a Wednesday. Investor/RT will load 2 days of 13 minute bars, dating back to 1:30 PM EST on the prior Monday. We should have 60 bars with which to create our chart. ( (60 minutes/hour* 6.5 hrs/session * 2 sessions) / 13 minutes/bar)
Since the "Use Highs and Lows" checkbox is checked, the data will be processed for each bar as follows:
if (UP) // currently in an up column { process HI; if(HI did NOT produce any new X's) process LO; // check for reversal } else // currently in an down column { process LO; if(LO did NOT produce any new O's) process HI; // check for reversal }
If this checkbox had not been checked, we would simple process the closing prices for each bar and ignored Highs and Lows.
Once our chart is completed, we now draw a line at the right of our last column to denote the end of historical data and the beginning of our "Live Chart", if you have the "Live Chart" checkbox checked. Since it is 1:30 PM EST, the session is open, and ticks should be flowing in on INTC. As the ticks come in, our chart will dynamically update to reflect the processing of each tick. If "Live Chart" is unchecked, then the chart will only change as each bar is completed. For instance, if you were viewing a 13 minute chart, you would see the price marker move up and down throughout the 13 minute period, but your will not see new boxes or lines form until the 13 minute period is completed. (At which time you may still not see any new boxes or lines depending on the closing price of the bar.)
If at any time, you click in the chart while holding down the "Ctrl" key, then the chart will automatically be rebuilt from historical data, again based on your periodicity, viewing period, and data processing setting (Use Highs and Lows). This will cause our vertical line to again be repositioned at the right side of our chart, pending further ticks.

