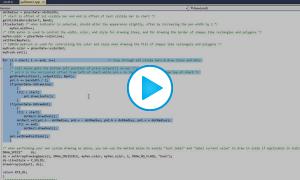
This video on RTX Development details the important draw() function which takes the resulting arrays of the calculation function and presents the indicator visually in the chart. In this example, we draw a simple moving average with an optional dot on each bar and optional line between each bar/dot.
This video on RTX Development details the important calc() function which takes the bar data and transforms it into an array of output data which can then be used by the draw function. In this example, the close price is converted into a simple moving average of close.
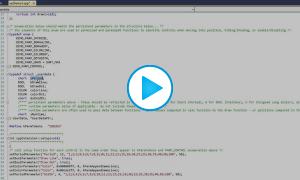
This video on RTX Development discusses how to create and manage the parameters of RTX indicators. Parameters are the controls such as checkboxes, listboxes, or color controls, that are provided to the user within the preference window to adjust the settings of the indicator. Functions covered in detail in this video include: setup, parmsLoad, and parmsUpdt. The video also explained how to maintain the parameter enumeration and structure.
In this video on RTX Development, an overview is provided for the primary functions that RTX developers will need to respond to. Functions covered include: setup(), init(), parmsLoad(), parmsUpdt(), keyboard(), mouse(), calc(), and draw().
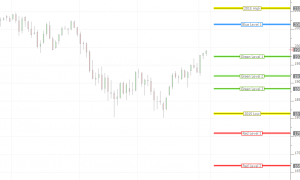
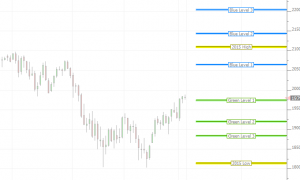
The FlexLevels® Indicator facilitates the sharing of key price levels for one or more instruments among a group of Investor/RT users. An educator or trading room mentor or an individual trader first creates a chart with the instrument(s) and the desired reference lines he wishes to share. Using File > Functions > Export FlexLevels, the price levels are exported to a compact text file (a .csv file). The exported file contains all of the information about each line/level including: price, label, color, width, position details, and band details, if applicable.
This video demonstrates how to take the project created as a result of the video RTX Project Setup in Visual Studio and use that project as a template for new RTX projects. By creating a template, we greatly simply the setup work required when creating a new project. This process will make it quick and easy to crank out new RTX Indicators. Naming convention options for RTX Indicators is also discussed. This process requires Investor/RT 12.5b4 or later.
This video demonstrates in detail how to setup an RTX project in Visual Studio. A step by step process makes it quick and easy to get started with RTX development. In this video, Visual Studio Community 2015 is used. RTX development SDK includes libraries for building RTX DLL using Visual Studio 2017, 2015, 2013 and 2010. The resulting project from this video will be used in the subsequent setup video as a template to facilitate quick and easy setup new projects without the burden of repeating all the project setup steps.
This video introduction to RTX Development presents what is possible with the powerful suite of software development tools in Investor/RT called RTX. Investor/RT users now have the same development power for developing indicators that Linn Software developers have had for 20 years. Complete control of drawing, calculations, preference positioning and manipulation, drag and drop, and keyboard shortcuts. Access to the market depth, trading integration, volume at price, or the results of any built-in Investor/RT indicator.