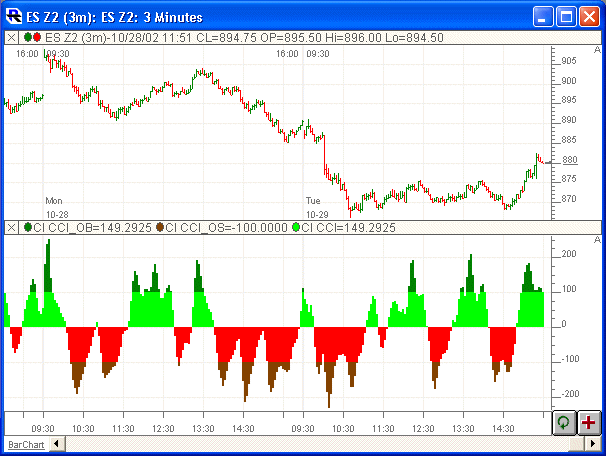
This Tutorial will demonstrate how to color extreme levels of histograms, as seen in the chart above. It will cover the following topics.
- Creating custom indicators that represent different levels of an oscillator
- Overlaying three custom indicators in one chart pane
- Adjusting the order of elements in a chart pane
This tutorial will involve coloring extreme levels of a CCI histogram, but can be used more generally for any oscillating indicator. We will paint these levels different colors. These extreme levels include the area when CCI is above 100 (strong uptrend) and the area where CCI is below -100 (strong downtrend).
First, we need to create three Custom Indicators. Go to "Setup Prefs: Custom Indicators". Below, you'll see the setup for the first Custom Indicator. We'll call this custom indicator simply "CCI".
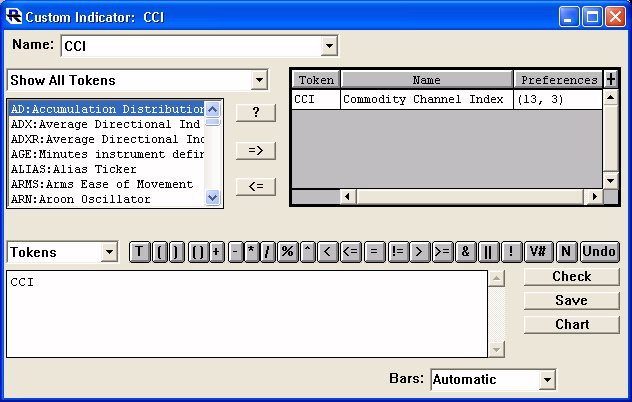
Custom Indicator for CCI
This custom indicator is extremely basic, but required in order to demonstrate what we are hoping to accomplish.
Now, let's create two other Custom Indicators. We'll call the next custom indicator "CCI_UP" to represent the CCI are where the CCI is above 100. The custom indicator setup window can be see below.
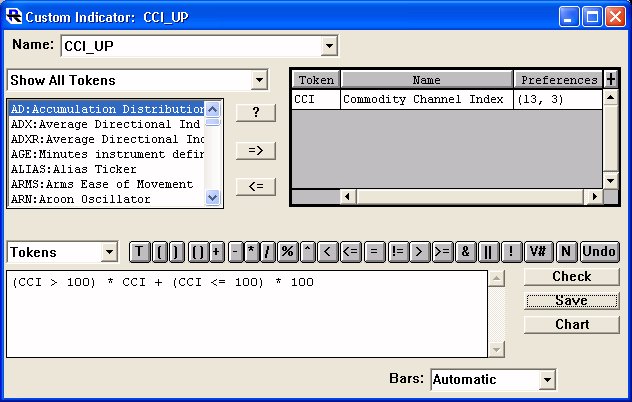
Custom Indicator for CCI Up
Let's take a closer look at the syntax for this indicator to figure out exactly what's going on. Boolean (True/False) expressions, such as:
(CCI > 100)
will always result in either "0" or "1". If the expression is true, the result will be 1, while if the expression is false, the result will be 0. Also, whenever CCI > 100 is true, CCI <= 100 will always be false. Conversely, whenever CCI > 100 is false, CCI <= 100 will always be true. In other words, one, and only one will be true (1) at any time. Therefore, the eventual result of the custom indicator will be either CCI (if CCI > 100) or 100 (if CCI <= 100). The reason we have created our custom indicator this way will be more evident when we add it to our chart.
Now, create the third and final custom indicator. It will be very similar to the custom indicator above, except we'll name it "CCI_DN" and it will have the following syntax.
(CCI < -100) * CCI + (CCI >= -100) * -100
This custom indicator will result in -100 when CCI is below -100, otherwise it will just be -100.
Now, let's go to the chart. First, add the custom indicator "CCI" using the settings seen below. Add it to a new chart window pane.
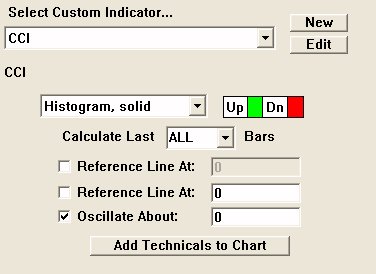
CCI Custom Indicator Preferences
Now, add the custom indicator "CCI_UP" to the same window pane as the CI "CCI" using the preferences below.
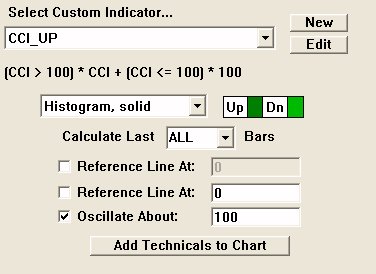
CCI Up Custom Indicator Preferences
Finally, add the custom indicator "CCI_DN" to the same window pane as the CI's "CCI" and "CCI_UP" using the preferences below.
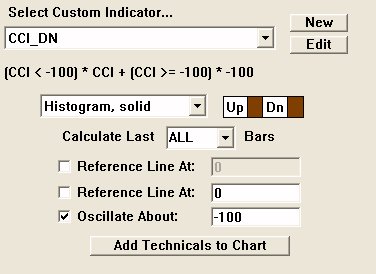
CCI Dn Custom Indicator Preferences
Notice that these indicators oscillate about 100 (CCI_UP) and -100 (CCI_DN). Since the CCI_UP indicator is equal to 100 whenever CCI is below 100, then having the CI oscillate about 100 will cause the indicator to draw nothing except when CCI is in the extreme region above 100. This is what we're looking for.
You may have to make a couple of last adjustments. You'll want to make sure "multi-scaling" is turned off (double-click in the vertical scale to access vertical scale preferences). Also, you may have to "re-order" the elements (CI's) within your window pane to make sure that CCI_UP and CCI_DN are draw in front of CCI. To access the element ordering pane, simply shift-click in the vertical scale. You'll need to make sure that the CCI Custom Indicator is the last element in the list (as seen below).
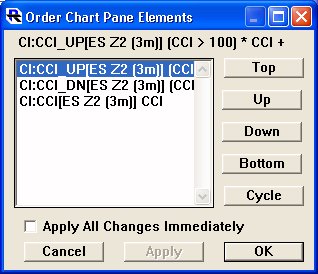
Chart Pane Element Order
Lastly, in order to get the histogram colors to draw properly (up color when above 0, and down color when below 0), you'll need to go to "Setup Prefs: Charts: General" and make sure the setting "Color Histograms Based On" is set to "Positive/Negative Values" is specified.
Again, this concept can be applied to any oscillator style indicator. Just change the 100's and -100's to the extreme value that are relevant to your oscillator. Also, you're not limited to coloring just the upper and lower extreme values, you can add more custom instrument based histograms to the same window pane to color several ranges of values. For instance, you could color the range from 50 to 100 yet another color.
For additional information or assistance on this indicator, open a support ticket.

