So when volume profile histograms are displayed for each intraday bar (let's say 30-min bars) , the maximum width of the histogram is the same for each 30-min bar. All the histograms are the same width regardless of the amount of volume in each 30-min period. So I can't tell from the histograms if the volume was large or small during that period. So I wonder if there's a way to scale the volume histograms across the entire day so that I can compare the relative volume profile sizes for each 30-min bar?
Coloring Lines & Histograms
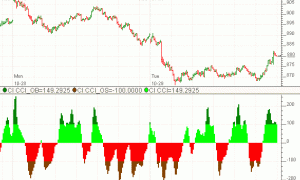
This video demonstrates how to color line and histogram-style indicators different colors based on various conditions.


