Hello,
I'm posting a current chart of ES futures shown in the US Stocks session 9:30-4:00pm Eastern Time.
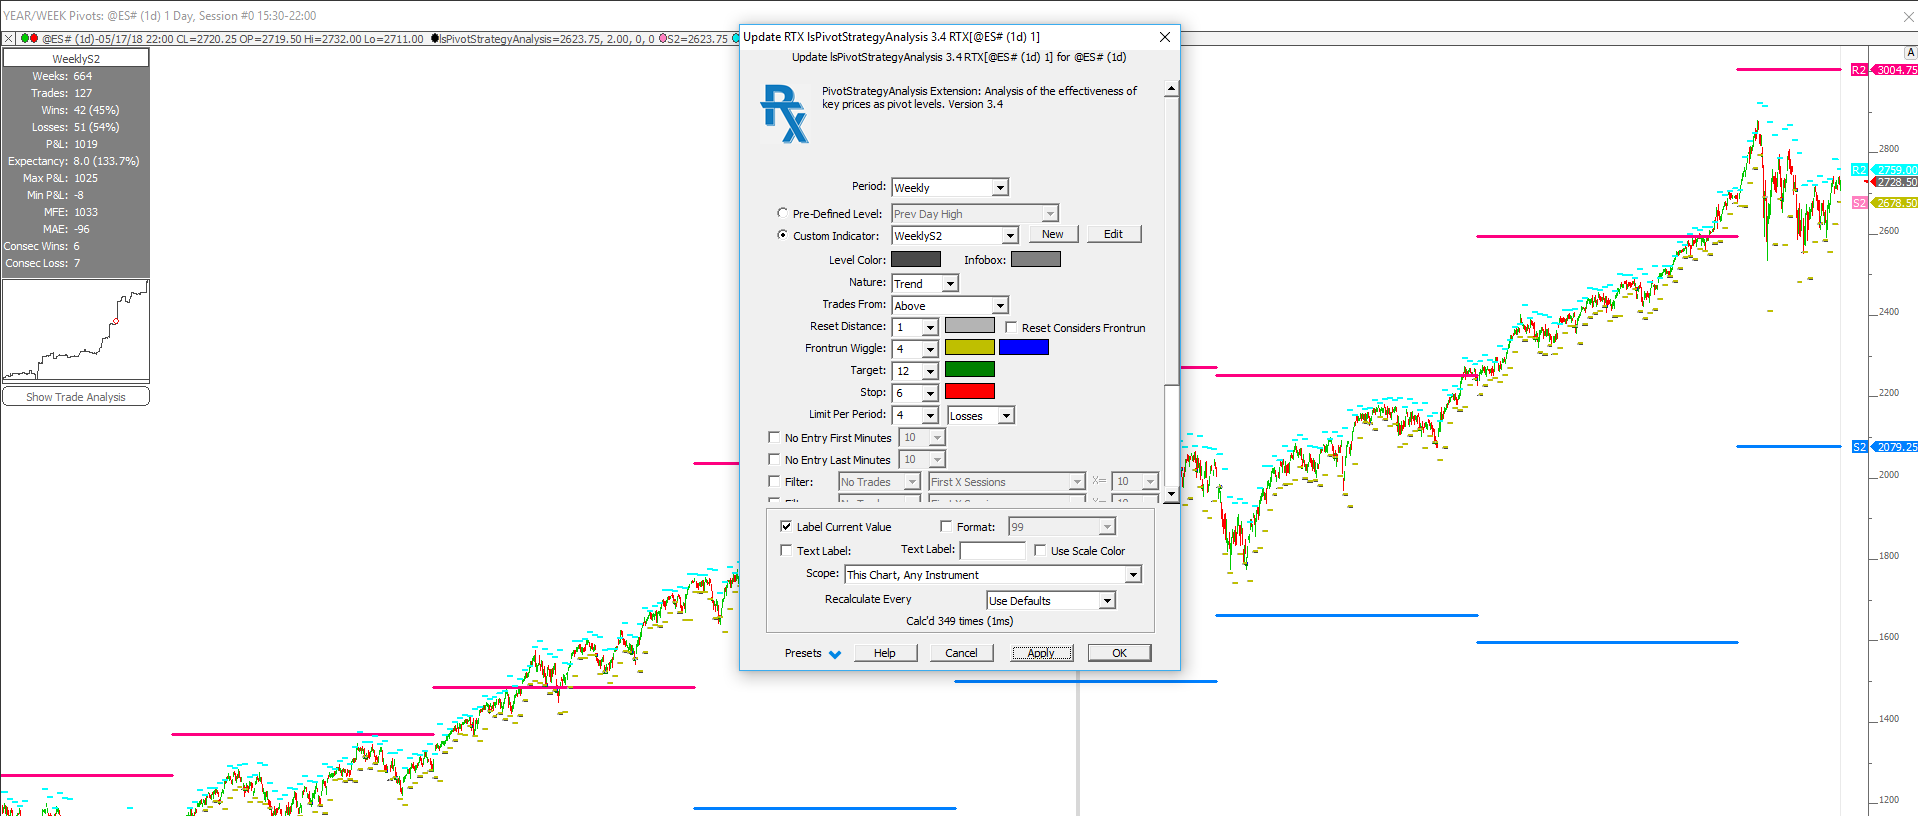
I'd like to know if this would be the right approach of finding the probabilities to buy weekly S2 during real time market hours.
What I don't understand is how if the target can be 12 and stop 6, how is the max P/L: 1025 and min P/L only -8?


You have the Period set to "Weekly" meaning if still in the trade at end of the week, it will get out at Friday close. Is that what you want?
Also, with periodicity set to daily, PSA doesn't have much to work on. It only has the daily open, high, low, and close, and has no knowledge of what happened within those days, so having to make many educated guesses without those details. You probaly want to change periodicity to something like 30m or even 1m to get more precision. With daily bars, it could hit both target and stop, often, in same bar. With 1-min, we know which one was hit first.
You also have Nature set to Trend. Do you want that, or do you want to Fade this S2 level from above and go long?
Hi Chad. I would actually like the trades to be intraday. So I changed the chart periodicity to 1 minute. In the PSA I set the period to daily and changed to fade from above or going long when price fell to S2.
I'm still not understanding P/L, max and min P/L. Also, are the targets and stops calculated in ticks? That means for the points I would set either to 12 ticks.
Thanks Chad
All values you see are calculated in ticks, yes. Targets and Stops are in ticks. PNL is in ticks. Max PNL is the highest the PNL ever achieved during the duration of the chart.
If you set Period to Daily, that means it's going to force out of a trade (that hasn't hit target or stop) at end of day at close of last bar. You also might want to put in some conditions to not enter during last 15 or 30 minutes of session. Can do that with one of the Filters at bottom.