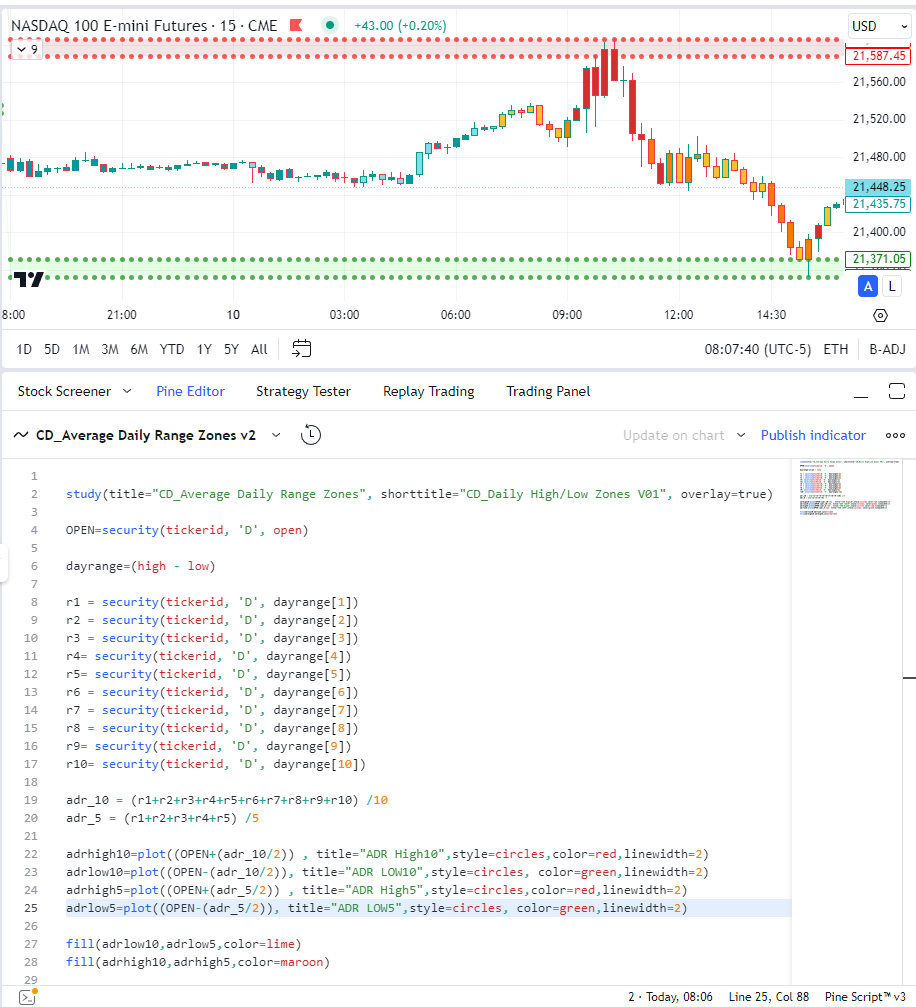
I was wondering if anyone could help me code this in IRT. Or figure out the right indicators to use to make it happen.
I want to create these same bands on my chart in IRT, that I currently have in TradingView.
All it's doing is looking at the past 5 days of ranges and 10 days of ranges, and coming up with an average for each.
So each of the past 5 day's, single daily range, is added together, then divided by 5, and ditto for the 10d.
Then 1/2 of the 5d average is added and subtracted to today's opening price, to form a support/resistance line.
And 1/2 of the 10d average is also used as above.
This forms a band above, and a band below, the opening print, that is between the 5d and 10d average daily ranges. (see attachment).
I think this can be done with some combination of SESST and MPD, but I'm not exactly sure how. Also, filling in the bands might be more complicated and are really just a 'nice to have'.
Any help would be appreciated. Hopefully this is understandabe.


Hi,
This is the typical case for using the token associated with the MPD indicator
Indeed, what you want to do is to display a value calculated from a daily bar periodicity (ie the Open and some average value derived from daily HI-LO range) to an intraday chart
In that case, the approach is always the same: first create a custom indicator that would calculate the value based on daily bar information and then use the mixed periodicity feature of the MPD indicator to extrapolate/display this value on an intraday chart
Let's consider the top line value of your bottom band
First step : you create a Custom indicator (to be named LOWERBAND_TOP_DLY) as if you would display (on a daily chart) the top value of that lower band on a daily chart
Typically, the syntax of this indicator will be OP -0.5*MA.1 with
OP : the open of the current daily bar
MA.1 being equal to the average daily HI-LO range of the past 5 day
I added .1 to the MA token (set up as the HI-LO Range) as you don't want the range of the current day to be integrated in the average calc) , ie I look one bar back, at the avg HI-LO range of the completed past 5 days)
Second step : you create another custom indicator (01_LOWERBAND_TOP_MPD) that will be equal to the Mixed periodicity value of that custom indicator, with the mixed periodicity period being 1 day (1 day*), ie when this indicator will be added to any intraday periodicity chart (1 min, 5 renko, etc), it will return the value of the underlying indicator (LOWERBAND_TOP_DAILY) as if it would have been applied to a 1 day periodicity
That's it
Then you repeat similar steps for the lower BAND bottom line value (using the 10 day average of the HI-LO range), and for both lines for the upper zone.
For getting a nice band display, a simple option is to use the stepped block style of the band indicator as used on the following shared chart :
https://www.linnsoft.com/charts/ef-hilorange-bands-es
Note : An alternative advanced option (to display bands) would be to use the more versatile Paint indicator that would allow you, for example, to change the color of the band based on another signal or custom indicator derived value or criteria
Thank you so much. This is perfect!