This topic is created for open discussion on all aspects of Renko Charts. Users are encouraged to respond to this topic with questions or additional information of any nature related to charting or trading Renko.
Renko is a periodicity that is driven by price movement rather than time or volume. The word Renko is believed to be derived from "Renga", the Japanese word for brick.
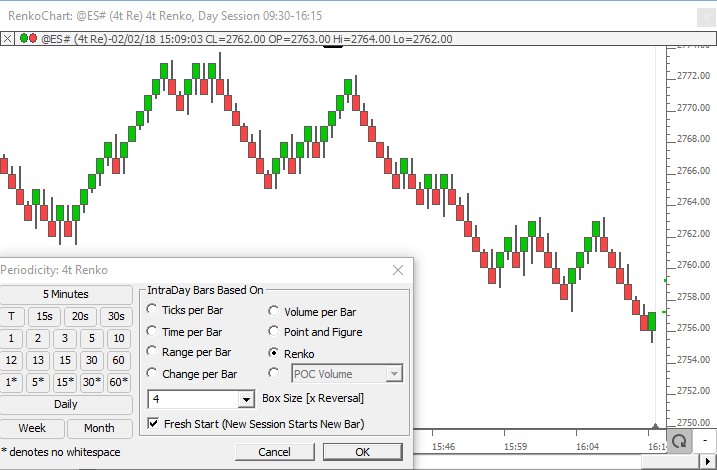
Below is a 4 tick Renko Chart of ES draw as candles. The body of each candle is 4 ticks in range (1 point). The term "brick" is often used to refer to the candle body of Renko, and Renko is traditionally drawn as "Wickless Candles", however, showing the candle wicks does provide additional information about where price travelled during the formation of each Renko brick. Bricks continue to form in one direction until a reversal occurs. A reversal requires a move in the opposite direction of twice the magnitude of periodicity (8 ticks in chart below).


UniRenko allows the user to provide an additional reversal criteria, commonly twice that of the brick size, in the format 2x4 (brick size x reversal criteria).
To turn on UniRenko, set the configuration variable UniRenkoModifiedOpen to True (File > Preferences > Configuration).
Below is a 2x4 UniRenko Chart. Notice the periodicity is specified by playing the reversal criteria (in ticks) after the x. Without the x, the chart will be implemented as a standard Renko. For a 2x4 UniRenko, 2 ticks is used to continue to add bricks in the existing trend direction, but the 4 ticks is required for a reversal. The bars are also artificially presented with a candle body of 4 ticks, resulting in all candle bodies overlapping the previous candle for visual effect.