Hey Chad,
I've got a 2 pronged question about how these are working. Sorry if you've explained this elsewhere, I've tried to search but hadn't found the solution.
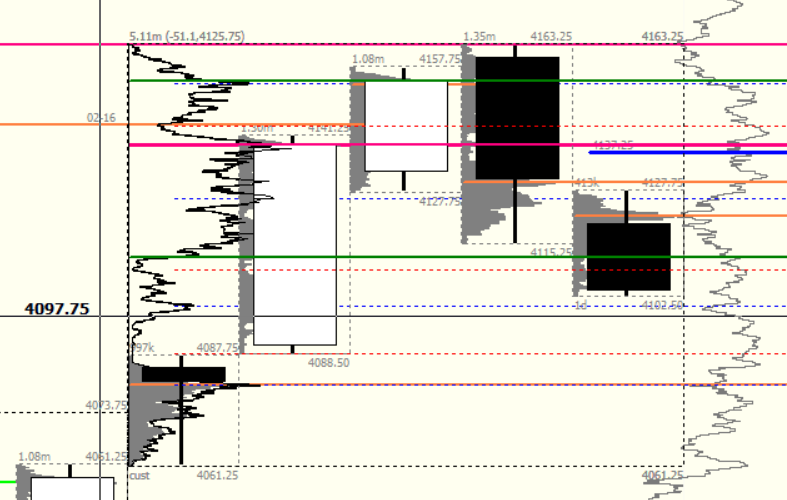
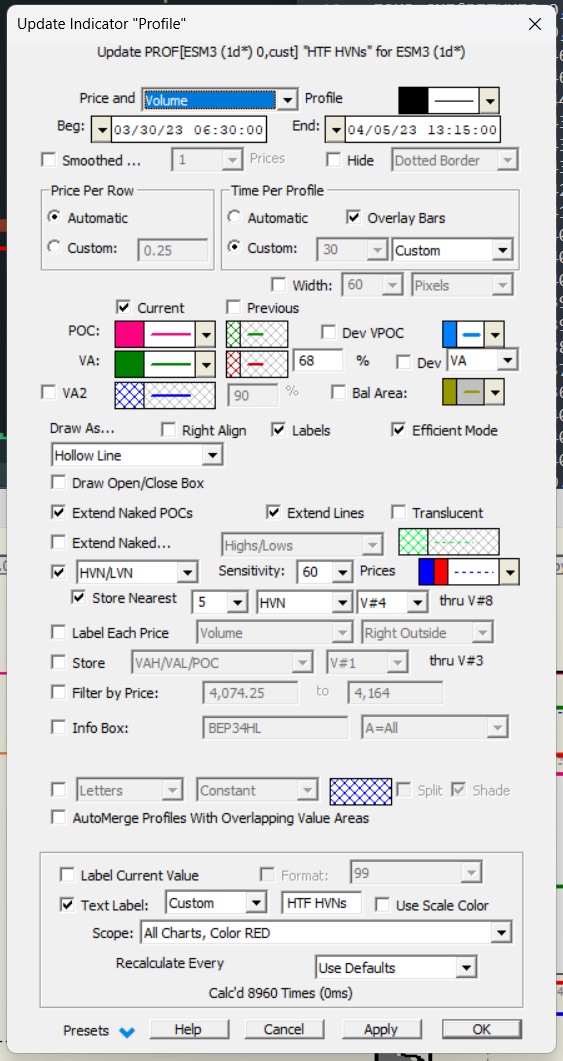
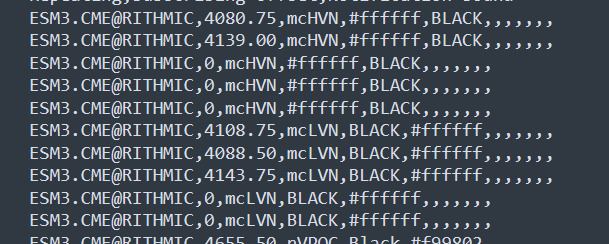
I have a profile drawn across a period of consolidation and am pushing the top 5 HVN's to the V# variables, but in the CSV file, only 2 show up (for instance, there's a HVN line being drawn at 4100 but it isn't showing up in the CSV.) Do I have this set up correctly or am I missing something?
The second part of this question: as of right now, I have 2 duplicate profiles ontop of each other, one exporting HVNs and one exporting LVNs across the same period. Is there a cleaner way to do this? The "HVN/LVN" dropdown option worked, but I couldn't find where to specify how to label each, they just showed up as whatever I had named all of the variables.
Thanks so much, I super appreciate it.