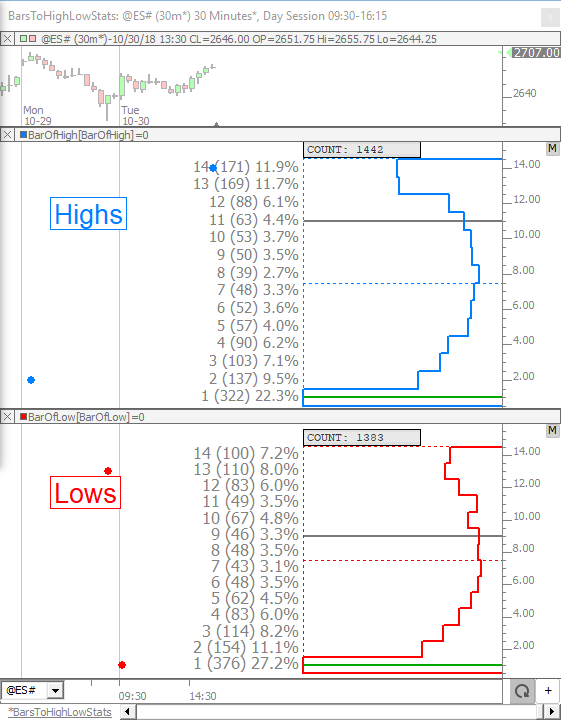
This chart counts the number of times the high and low was made during each period of the day (in this case, each 30-minute period or bar). In the middle pane, the 1 (322) 22.3% tells us that 22.3% of the days, the high was made in the 1st period (1st 30 minutes) of the session. The count of 1442 at the top theoretically tells us how many days we are observing. However, if the high was touched by more than 1 bar/period during a day, then both of those bars are considered and that's the reason the count on highs does not match the count on low (more days where high was touched in multiple bars). This chart may be changed to any other symbol, as well as any minute-bar periodicity (15 minutes, 5 minutes, 60 minutes, etc). To cut the day right in half, change to 203 minutes (for the 405 minute ES session of 9:30am ET to 4:15pm ET). Charts session may also be changed. I'm inculding a chart below that presents time into session instead of bar/period into session...
https://www.linnsoft.com/charts/barstohighlowstats-es

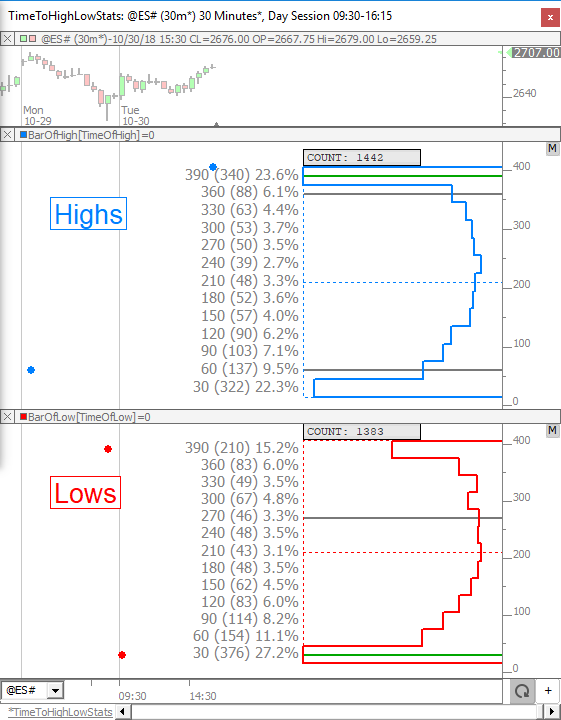
The chart below presents same information but labels each entry in the profile with the ending time of each period. So for our 30 minute chart below, in the middle pane where you see 180 (52) 3.6%, the 180 is the time into the session that the bar ended. So this bar went from 150 minutes in to 180 minutes in (noon ET to 12:30pm ET). Otherwise, all is same as chart above
https://www.linnsoft.com/charts/timetohighlowstats-es


By setting the ES chart to 203 minutes, we are summing up the data of the 1st half of day (203 minutes in. 9:30am to 12:53pm ET) to the 2nd half of day (last 202 minutes. 12:53pm to 4:15pm ET).
Looking at the result below, there is clearly a stronger tendency for the low to be made in the morning (63.3%) than the high (55.8%).
and further splitting the session into 3 periods (each 135 minutes) shows how infrequntly the highs and lows are made mid-session...
Chad: Nice work here, thank you for the setup.
A