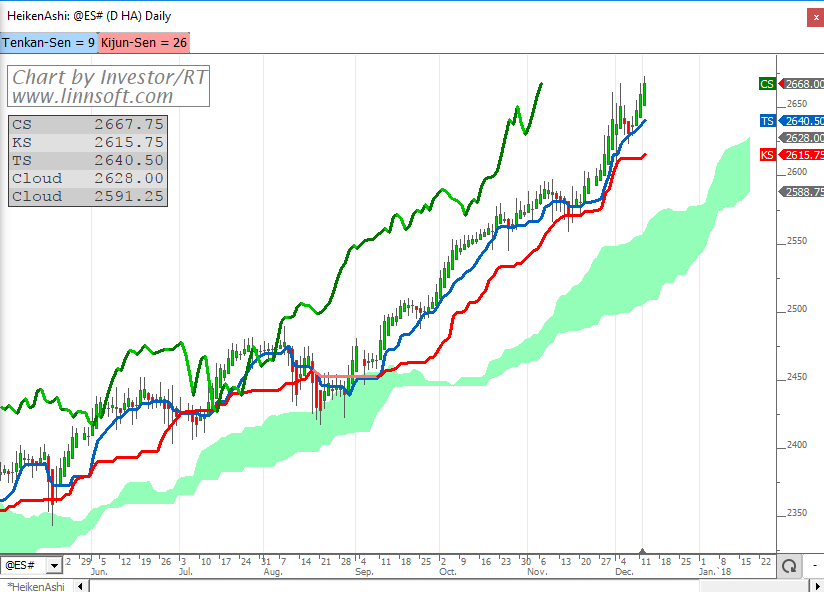
Below is a chart of Heiken Ashi bars with Ichimoku Kinko Hyo indicators. Use the link to access the definition and import into Investor/RT. A full explanation of chart is provided below chart image. We encourage any users with knowledge and expertise in trading and analysis of Heiken-Ashi and Ichimoku Kinko Hyo to reply to this topic and share by replying to this topic. Also, if you there are additional components that you would like to see added to this chart that would be valuable in supplementing these bars and indicators, please share the details.
Heiken-Ashi Chart
Note:
This chart requires Investor/RT 13.1.3 or later.

Chart Details
- Candles are Heiken-Ashi with prices computed as follows. Heiken-Ashi is turned on via the layered option in the Update Instrument window.
- HA Close = (OP + HI + LO + CL) / 4
- HA Open = (CL.1 + OP.1) / 2
- HA High = MAX(HI, HA Close, HA Open)
- HA Low = MIN(LO, HA Close, HA Open)
- Green and Pink Cloud is the Ichimoku Cloud and this cloud is drawn between lines Senkou Span A and Senkou Span B.
- Blue Line is Tenkan-Sen
- Red Line is Kijun-Sen
- Green Line is Chikou-Span
- The blue button at the top controls the period used in the calculation of Tenkan-Sen (defaults to 9). This period is also used in the calculation of Senkou Span A. Changing this period will change these two indicators as they both share the same underling variable (C#1).
- The red button at the top controls the period used in the calculation of Kijun-Sen (defaults to 26). This period is also used in the calculation of Senkou Span A. A multiple of this period (twice) is used in calculation of Senkou Span B. This period is also used for the left shifting of Chikou Span and the right-shifting of the Ichimoku Cloud. Changing the period with this button will impact each of these elements as they all share the same underlying chart variable (C#2).
- Use the chart definition link above the chart to import the chart into Investor/RT. Once imported, users may customize this chart with their preferred symbol, periodicity, periods, and colors. Once customized, users may duplicate the chart as many times as needed by right-clicking on the chart and choosing "Duplicate" and then giving the new chart a unique name and then changing the symbol and/or periodicity of that duplicate chart.


