tutorials

Tutorial - Scan Tutorial - Setting Data Columns

Let's looks at the following scan.....

SET(V#1, LRS) AND SET(V#2, CL-LO)

In this scan, we will be using the SET operator to set the values of the V#1 and V#2 custom data columns. Let's use a periodicity of Daily again for the scan, and choose an appropriate input quotepage on which to run the scan. The ".All Symbols" quotepage contains all the symbols defined in your system. If you are just getting started, you may want to select this one.

Tutorial - Creating Scans

scanWin

Important Note: This tutorial was originally developed for scans, before the language to write them was referred to as RTL. However, this tutorial will be equally useful in general as a tutorial on RTL for signals and custom indicators. The one difference with scans, is that they allow the user to supply a quotepage and a periodicity for the scan to run on. These items are not present in the signal and custom indicator windows. But the RTL logic applies equally to all three.

This Tutorial will be helpful in the following areas...

Tutorial - Compound Scan

Let's looks at the following compound scan.....

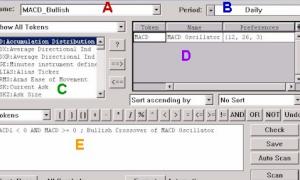
MACD1 <= 0 AND MACD > 0

In this scan, we introduce two new concepts: the compound scan, and the qualified scan token. We are going to run this scan on daily data to find MACD bullish crossovers. In other words, the MACD value for the previous day was less than or equal to zero, while the current day's MACD value is greater than zero.

Tutorial - Scans - Arithmetics in Scans

Let's looks at the following scan.....

(HI + LO + CL) / 3 > MA

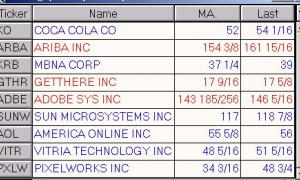
In this scan, we will emphasize the importance of bracketing or parenthesizing when using arithmetic in scans. We will run the above scan on Daily data. As you can see from the expression above, this scan is taking the average of today's High, Low, and Closing prices and comparing that average with a moving average. The quotepage that results will consist of instruments whose current days average is greater than it's moving average.

Tutorial - Rule Testing In Backtests

If you click on BUYSTOP in the list of actions, the description appears "Buy to Exit Short Position". This rule action is normally used as a stop loss rule to buy (cover) the short position if the market rises against you above some level. For example, you can have a BUYSTOP rule with the signal formula CL > ENTRY * 1.05; This would exit the short position if the price of the stock rose more than 5% higher than the price at which you shorted.

Tutorial - Relative Performance Charts

rpc_chart

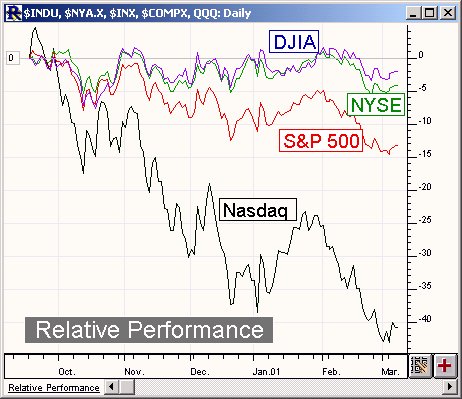
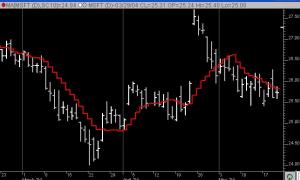
This trader's tip will discuss creating a Relative Performance Chart in Investor/RT as seen below ...

rpc_chart

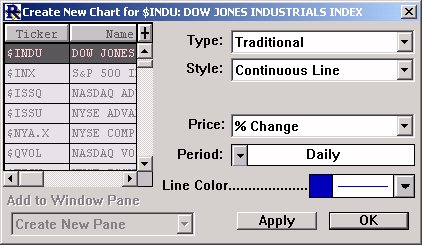
To create a Relative Performance Chart in Investor/RT, first choose from the main menu, "File: New: Chart". Specify the following settings for your new chart...

rpc_newChart

Tutorial - Demonstration Version

demoqp

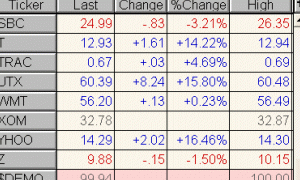
Investor/RT provides a test data generator via the special ticker symbol $DEMO. $DEMO can be setup as a stock, future, index, or option, and can be assigned to whatever trading session you like. During the trading hours of its associated session, $DEMO trades once per second with random incremental price moves.

Pages