Price Based

Indicators that study price movement with the goal of showing when an instrument is overbought or oversold.

Price Volume Pattern (RTX)

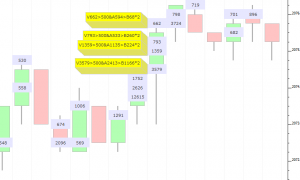
PVP is a powerful order flow pattern matching facility that works hand-in-hand with VolumeScope. It is designed to identify buy and sell volume-based patterns within a sequence of one or more prices within each bar. One-price, two-price and three-price patterns can be identified at the high of bar, low of bar, the highest or lowest occurrence within the bar, or all occurrences within each bar. Within each price within a bar, volume, ask volume, bid volume, or delta may be compared to specific values, or to multiples of volume, ask volume, bid volume, or delta. A secondary criteria is optional for each price. Prices that meet the specified criteria are identified with a drawing style such as Solid Box, Hollow Box, Dot, or Line. Customization of each style is possible by specifying a number of horizonal slices and an offset (which slice) to use. Each PVP indicator in a chart can thus be setup to draw into a different slice for each price.

Vervoort Oscillator (RTX)

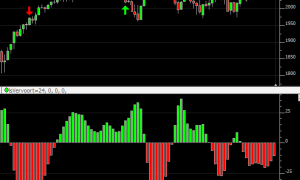
In his article "The Quest For Reliable Crossovers" (Stocks and Commodities Magazine, May 2008) author Sylvain Vervoort explains a trading method using the crosses of two moving averages: a zero-lag triple exponential moving average of the typical price HLC/3 and the Heiken-Ashi Close. The Vervoort Oscillator plots the difference between these averages. Vervoort recommended a 55 period average (1 period look back) on daily charts.

ToTheTick.com Power Zones

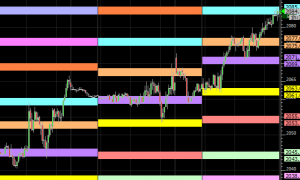
ToTheTick.com Power Zones is the Investor/RT implementation of the daily Power Zones offered by ToTheTick.com. This indicator is implemented via the External Data indicator which is specailly programmed for ToTheTick.com to dynamically grab the zone data from the ToTheTick.com servers. Users must obtain credentials from ToTheTick.com which are entered into the Power Zones preferences in order to activate the indicator.

Polynomial Regression Channel (RTX)

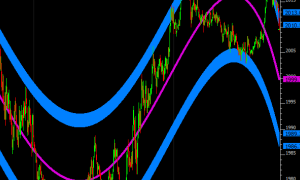
Polynomial Regression Channel (PRC) is an RTX Extension indicator that draws a best fit n-degree polynomial regression line through a recent period of data. Setup parameters for the indicator include the degree of the polynomial (1 - 6) and number of bars to analyze. Bands are drawn above and below the regression line between two user-specified multiples of standard deviation. The bands self adjust for volatility.

Math Lines (RTX)

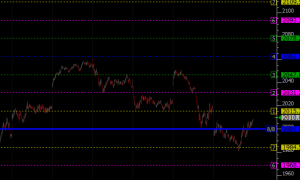
The Investor/RT Math Lines Indicator is the Linn Software implementation of the popular Murrey Math Lines. The Math Lines indicator produces a series of equidistant price-based support and resistance levels. Each level is labeled from 1/8 thru 8/8. The 8/8 (or 0/8) lines are considered the most difficult to break. 1/8 and 7/8 lines are considered weak support and resistance. 2/8 and 6/8 lines are considered strong reverse points. 3/8 and 5/8 are considered areas where it is very likely that the price will either pierce this range fast or will remain inside it for a long time.

Williams %R (WPR)

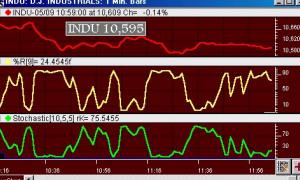
The Williams %Range (%R) Study, is the exact inverse of Lane's Stochastic Study. You may see the relationship between the stochastic and %R very clearly by charting the same symbol in two chart windows that are stacked vertically. Put the %R in one window and stochastics in the other as shown.

Stochastics

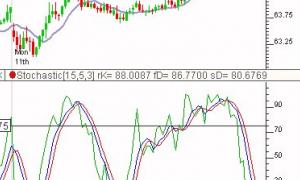
Stochastic is a momentum or price velocity indicator developed by George C. Lane.

Relative Vigor Index

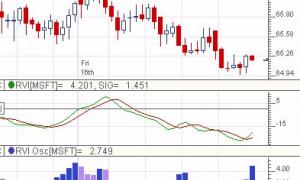
This indicator was developed based the January 2002 Stocks and Commodities article entitled Relative Vigor Index. This indicator is an oscillator built on the basic equation (CL - OP) / (HI - LO). The oscillator is basically in phase with the cyclic component of the market prices.

Relative Strength Index (RSI)

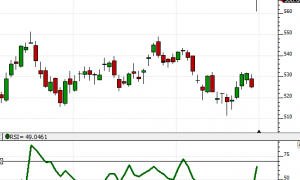
The Relative Strength Index (RSI) is a popular price momentum oscillator developed by J. Welles Wilder and introduced in his 1978 book New Concepts in Technical Trading Systems. The RSI oscillates in a range between 0 and 100 representing a comparison of the magnitude of a stock's recent gains to the magnitude of its recent losses.

In mathematical terms, RSI = 100 - 100/(1+RS) where RS is calculated as the ratio of two exponentially smoothed moving averages, AG/AL. AG is the average price gain over some period and AL is the average price drop over some the same period.

Rate of Change (ROC)

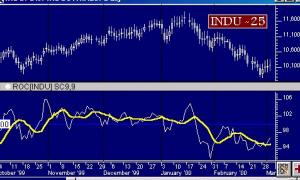
Rate of change is a price momentum indicator. It is a simple calculation of the current price divided by the price some number of periods ago. For example, if the current price is 50 and the price 30 days ago was 40, then the 30-day rate of change is 50/40 or 1.25. The result is multiplied 100 and the resulting line oscillates around the 100 reference line. An optional smoothing moving average may be applied to the raw rate of change. Either or both raw and smoothed lines may be draw in the chart window. Rate of Change is part of the Investor/RT scan language also.

Pages