prices

Session Prices (RTX)

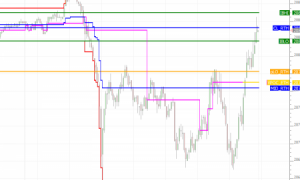
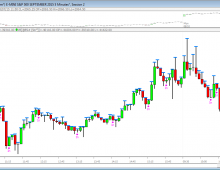
The Session Prices RTX extension calculates common price levels of interest on up to three different sessions independent of the session used by the chart. These types of calculations have been available in Investor/RT for some time but each line required its own instance of the Session Statistic indicator and perhaps the MPD indicator, making management of many lines difficult.

Day Session Prices

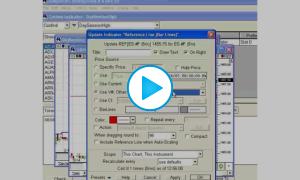
This video demonstrates how to display day session prices (high, low, open) onto charts that are setup on the 24 hour session (session 31). (Pro Version Required)

Plotting Time-Sensitive Prices

Plotting Time-Sensitive Prices

This video below demonstrates how to plot reference lines on multi-pane charts for various key time-sensitive prices including the previous session close, the current day session open, the overnight high and low, the opening range (OR), initial balance (IB) and several IB multiples. These concepts can be used to plot a variety of similar time-sensitive prices on charts of any periodicity and any session. The video covers various concepts including user variables, custom columns, custom indicators, and reference lines.

Current Price Highlighter

Current Price Highlighter

This video demonstrates how to highlight current price in the scale, and how to draw a dynamically updating line across the chart reflecting the current price, in a multi-pane chart.

Multiple Price Highlighter

Multiple Price Highligher

This video demonstrates the ability of the unique new MPH Indicator to identify a variable number of prices based on volume-at-price level in a variety of ways.

Custom Price Preferences

See Also: Custom Prices

custPricePrefs

Custom Prices

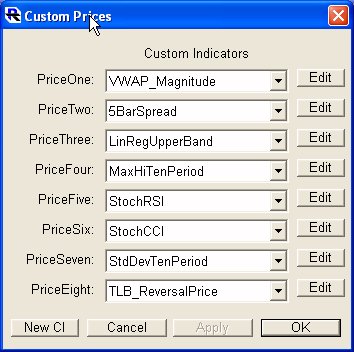
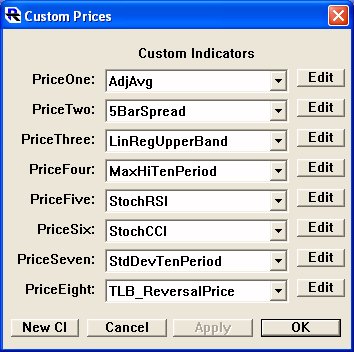
A powerful new feature is available in Investor/RT that allows the user to access Custom Indicator values anywhere that the "Price Type" options are available.

Custom Prices

A powerful feature is available in Investor/RT that allows the user to access Custom Indicator values anywhere that the "Price Type" options are available.

customPrices

Tips - Current Price Indicator

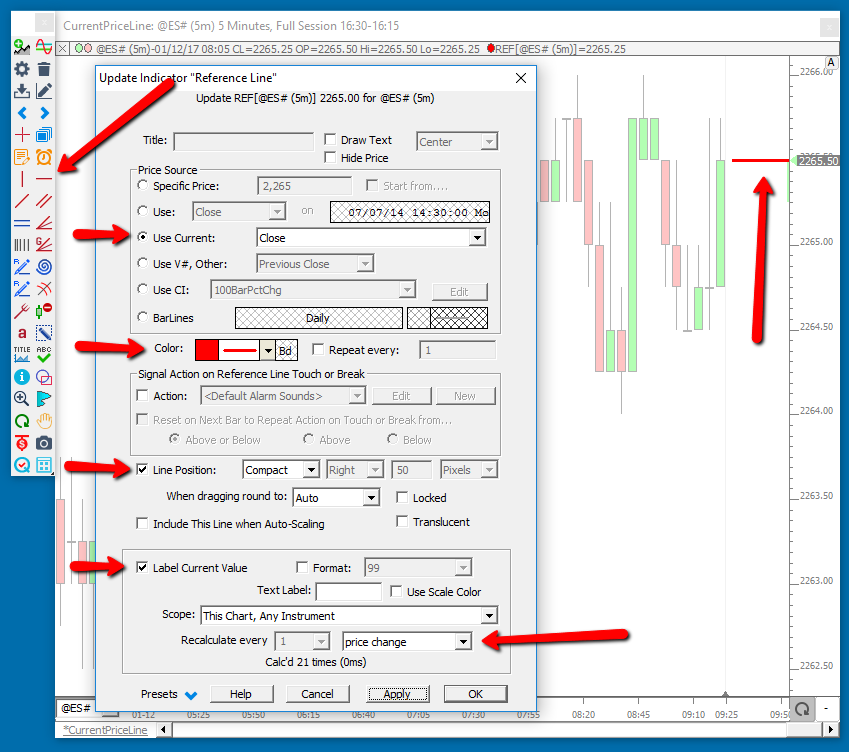
This tip explains how to use some new options on the Reference Line indicator to produce a nice dynamic current price text representation on your charts.

First, use the Reference Line Tool on the chart toolbar to add a reference line to your chart (anywhere will do for now). Then double click on the line to bring up the Reference Line Preferences. Now, make sure you have the following checkboxes checked...