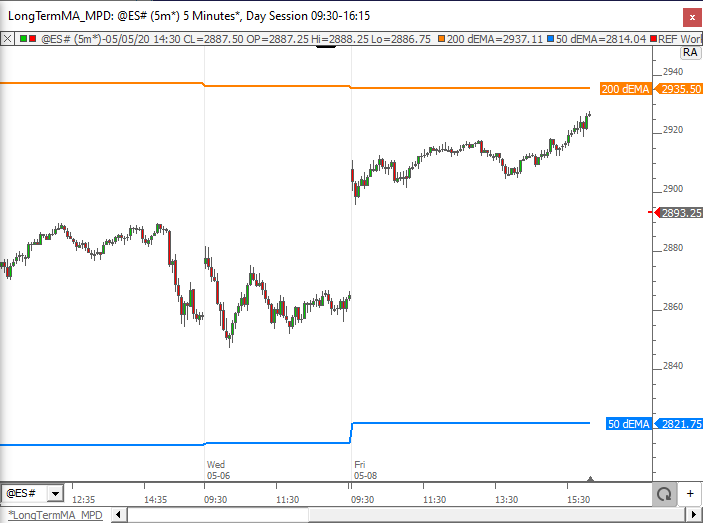
To add a long term Daily MA (in this case EMA) to an intraday chart...

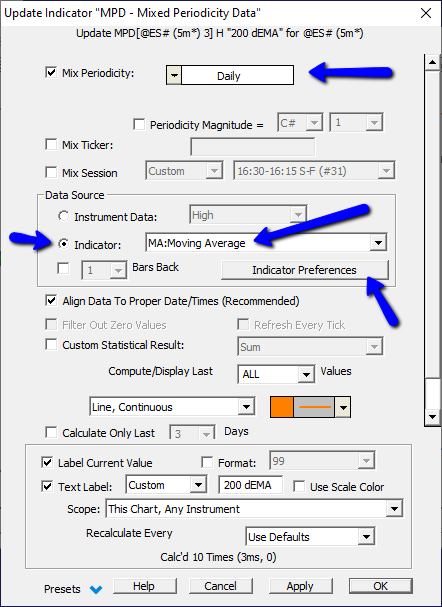
...use the MPD (Mixed Periodicity Data) indicator. Setup the indicator as seen below...

Click the Indicator Preferences button to setup the EMA settings as seen below...
This video demonstrates how to plot an overnight statistic on a chart that is not viewing the overnight period
This video details how to use a combination of the MPD and Session Statistics Indicators to plot the overnight high and low historically on a day session chart. It also documents a more complex requirement of plotting the high and low of a subset of the overnight period (1am to 8:30am ET) on a day session chart.
This video demonstrates how to plot the IB High and Low, Overnight High and Low, Previous (Globex) High and Low, Previous Close, and Day Session Open using a mixture of the Session Statistics Indicator and the MPD Indicator. The video also demonstrates how to paint the background of the day session a different color.
The Mixed Periodicity Data Indicator (MPD) gives the user access to different periodicities of data than the periodicity of the underlying instrument or scan. The MPD preferences ask for both a periodicity and the data (price) from that periodicity that will be displayed. MPD essentially loads data of another periodicity, the right-aligns it to the data of the underlying instrument or scan. The MPD data will not generally reflect the date/times show in the horizontal scale along the bottom of the chart. MPD should be consider on it's own scale.