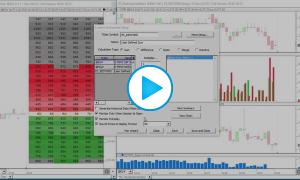
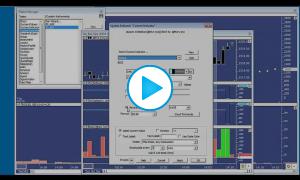
Resting Order Candles
This video demonstrates how to plot the resting orders (full size on the book/depth) historically as candles or bars. This same concept can be used to create bars which plot the sum of resting orders on the bid or the ask, or even the total on the 3 inside bid prices, the 5 inside ask prices. A great deal of flexibility in this area is provided by the Trail of Intentions indicator.


