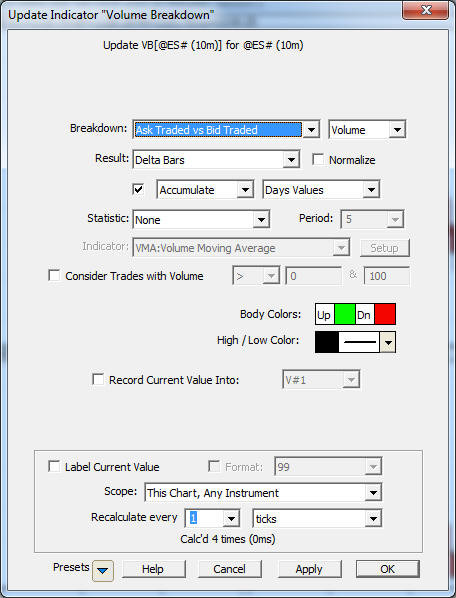
The Cumulative Delta is an option within the Volume Breakdown Indicator (VB). The most common VB setting for cumulative delta is to accumulate the days/sessions values and draw as "Delta Bars" as seen below.

The result is a set of candlesticks representing the cumulative delta for the session, building from zero at the start of each session, as seen in the bottom pane of the chart below
This video demonstrates how to efficiently compute the cumulative session delta for a large QuotePage of symbols by properly managing the Ask and Bid Volume data columns.
This video demonstrates new functionality for trendlines for maintaining their relative position as the cumulative delta data changes from day to day.
This video demonstrates how to access the price of the last up and down fractal of the cumulative delta bars. Warning, this is a relatively advanced usage of RTL.
This video demonstrates how access and plot the open, high, low, and closing prices of the cumulative delta bars.
This video explains how to access the open, high, low, and close prices of cumulative delta bars (volume breakdown). It also explains how to add indicators such as moving averages to the cumulative delta bars and how to create custom indicators that involve multiple volume breakdown tokens.
This video demonstrates how to add indicators to Cumulative Delta Bars (Volume Breakdown Indicator) including Moving Averages
This video describes how to add the Zig Zag Indicator to the Volume Breakdown indicator configured with cumulative delta bars.