Higher Close, Lower Volume
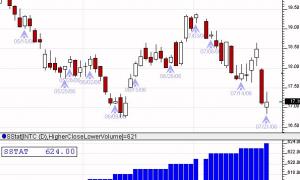
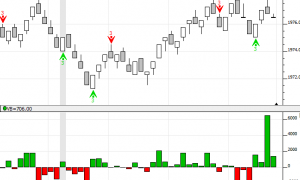
Higher Close, Lower Volume - This is a daily chart of INTC. The signals below the candles denote bars where the price closed higher than the previous day on lower volume. The lower pane shows how many days that has happened over the duration of the chart, which in this case, is 10 years.


