Statistic

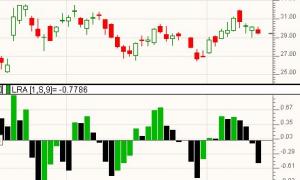
Linear Regression Acceleration

First, the data, based on the price selected, is smoothed using the moving average period and type. If you prefer no smoothing, choose a period of 1 here. The resulting data is then used to form regression lines ending at each bar, using the regression period specified. The linear regression acceleration of each bars regression line is then recorded as the change in slope of the regression line from the slope of the regression line of the previous bar. For instance, using the preferences specified above, the raw closing price would be used (smoothing period of 1).

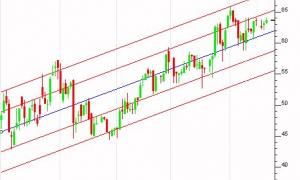
Linear Regression

Linear regression is a statistical tool used to predict the future from past data, and commonly used to determine when prices are overextended. The Investor/RT Linear Regression tool uses a least square method to plot a "best-fit" straight line through a series of data points. The data points used as input can be any of the following: Open, Close, High, Low, Hi+Lo/2, Hi+Lo+Cl/3, OHLC/4, %Change, or Op+Cl/2. These data points can be optionally pre-smoothed prior to construction of the best-fit line. If no smoothing is desired, simply chose a smoothing period of 1.

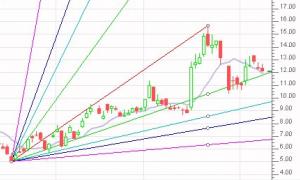
Gann Lines and Gann Angles

William Gann (1878-1955) developed a unique combination of geometric and mathematical principles, which he applied to trading stocks and commodities. The proportional relationship of time to price was the basis for much of Gann's work. Price and time come together in Gann angles, which project trend lines from important tops or bottoms. All of Gann's angles are quoted in price to time relations, (i.e., 1 x 8). Translated, this means move 1 unit of time to the right and 8 units of price, up or down. The angle representing price and time in balance is 45 degrees (1 x 1, price to time).

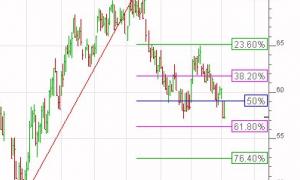
Fibonacci Retracements (FIBR)

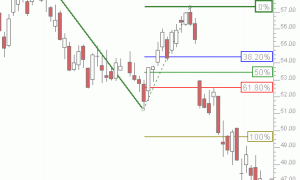
The Fibonacci Retracement / Expansion study is a very flexible tool in Investor/RT, allowing for drawing of both retracement and expansion lines, based on either price (horizontal), time (vertical), both. The Fibonacci trendline endpoints can be automated, can be user specified, can snap to extreme prices, or can even be set automatically to any custom value using a scan. Over 16 custom retracement/expansion levels can be drawn with each instance of the study. The price retracements can be based on either % levels, or absolute price ($).

Fibonacci Extensions

The Fibonacci Extensions tool is similar to the Fibonacci Retracements tool. The Fibonacci Extensions indicator requires a third point. The extensions and retracement levels are drawn from this third point, but based upon the distance between the first two points. A common use of this tool is to first connect two points that represent the endpoints of a major trend (or wave). Then choose the third point to be the endpoint of a retracement of that trend.

Candlestick Pattern Recognition (CPR)

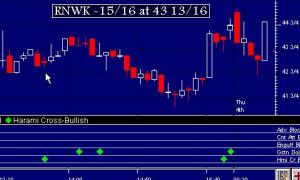
The candlestick pattern recognition indicator tests for any of 41 candlestick patterns of interest. When adding the indicator to a chart, choose as many patterns as you like from the list of available patterns. Other parameters include three values used by the indicator to perform the pattern matching.

Correlation Coefficient (COR)

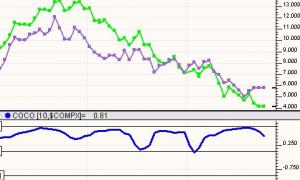
The Correlation Coefficient is a versatile pattern matching technical indicator. The correlation coefficient is a statistic used to measure goodness of fit of two series of data points. The indicator is used to compare actual price data with either specific chart patterns, or other price data. The correlation coefficient ranges in value between 1 and -1. A value of 1 represents a perfect correlation, while a value of -1 represents an inverted correlation. A value of zero represents no correlation at all.

Bollinger Bands

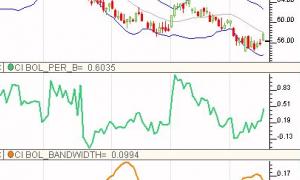
Bollinger Bands are volatility based bands used to help identify situations where prices are too high, or too low, on a relative bases. When prices reach or rise above the upper band, they are too high. When prices reach or drop below the lower band, they are too low. Bollinger bands are calculated by first smoothing the typical price using the MA type and period specified. The typical price for each bar is defined as (high + low + close)/3. The standard deviation is then calculated for the series of typical prices.

Alpha Indicator / Beta Indicator (ALPHA, BETA)

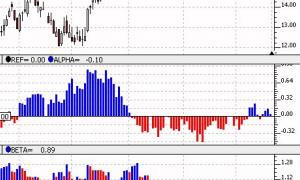
Beta measures the volatility of a security relative to something else, usually a benchmark index like S&P. To calculate beta, you scatter plot the bar to bar changes of the symbol (stock or fund) along with the bar to bar changes of an index on an XY graph (with the index going on the X axis) for a user-specified period. A best fit (regression) line is then drawn through these points. The slope of that line is beta, while the Y intercept is alpha.

Pages